Open Access
Fig. 1.
Download original image
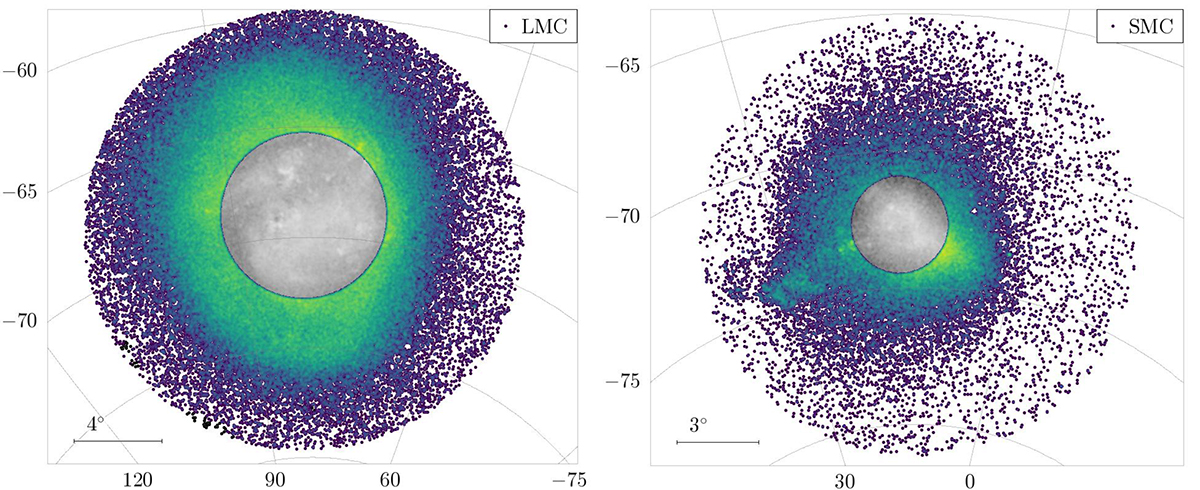
Distribution in the sky of the stars in our LMC sample (left panel) and SMC sample (right panel). Stars are colour-coded according to the local surface density. Stars excluded from the sample used for the detection of the RGB tip are plotted in grey-scale, while those retained are plotted in Viridis scale.
Current usage metrics show cumulative count of Article Views (full-text article views including HTML views, PDF and ePub downloads, according to the available data) and Abstracts Views on Vision4Press platform.
Data correspond to usage on the plateform after 2015. The current usage metrics is available 48-96 hours after online publication and is updated daily on week days.
Initial download of the metrics may take a while.