Open Access
Fig. 7
Download original image
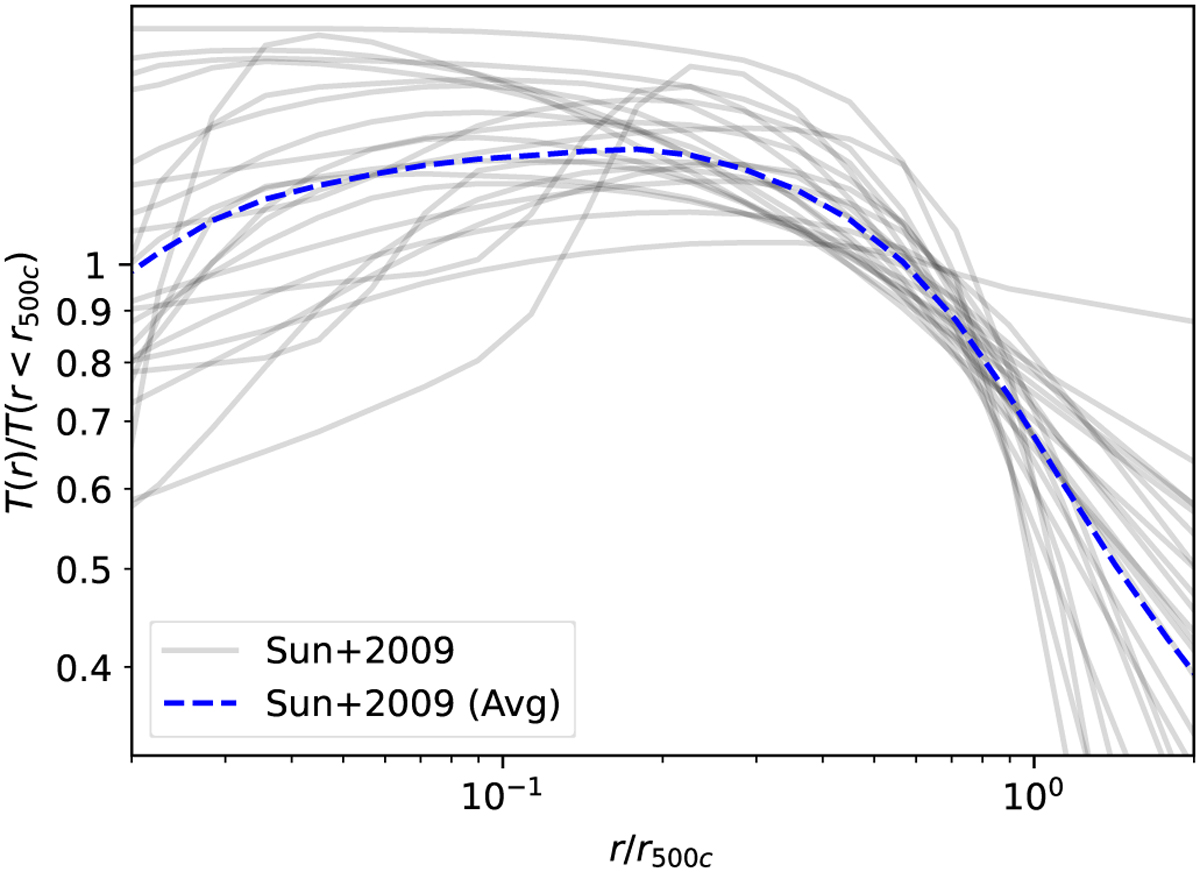
Normalized temperature profiles, T(r)/T(r < r500c), of 23 groups (gray) presented in S09 and their average (blue). The blue dashed line provides an average conversion ratio between the temperature profile, T(r), and the characteristic temperature measurements, T(r < r500c).
Current usage metrics show cumulative count of Article Views (full-text article views including HTML views, PDF and ePub downloads, according to the available data) and Abstracts Views on Vision4Press platform.
Data correspond to usage on the plateform after 2015. The current usage metrics is available 48-96 hours after online publication and is updated daily on week days.
Initial download of the metrics may take a while.