Fig. 6
Download original image
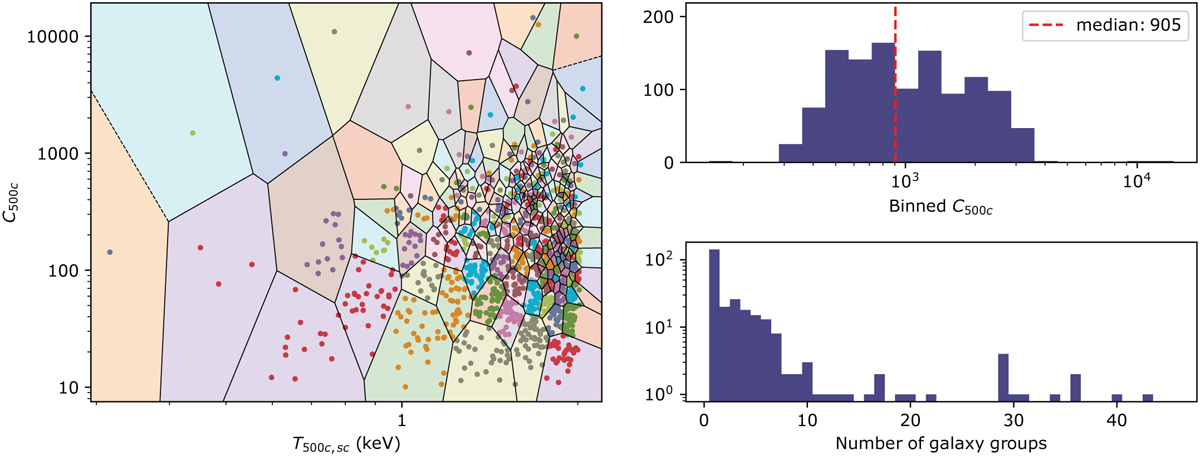
Left: Voronoi binning scheme used for grouping the sample obtained from the distribution of count (within r500c) measurements (C500c) and scaling relation based temperature estimates (T500c,sc). Top right: histogram of total counts in 271 Voronoi bins with a median of 905 counts. Bottom right: Histogram of galaxy groups in Voronoi bins.
Current usage metrics show cumulative count of Article Views (full-text article views including HTML views, PDF and ePub downloads, according to the available data) and Abstracts Views on Vision4Press platform.
Data correspond to usage on the plateform after 2015. The current usage metrics is available 48-96 hours after online publication and is updated daily on week days.
Initial download of the metrics may take a while.