Open Access
Fig. 9
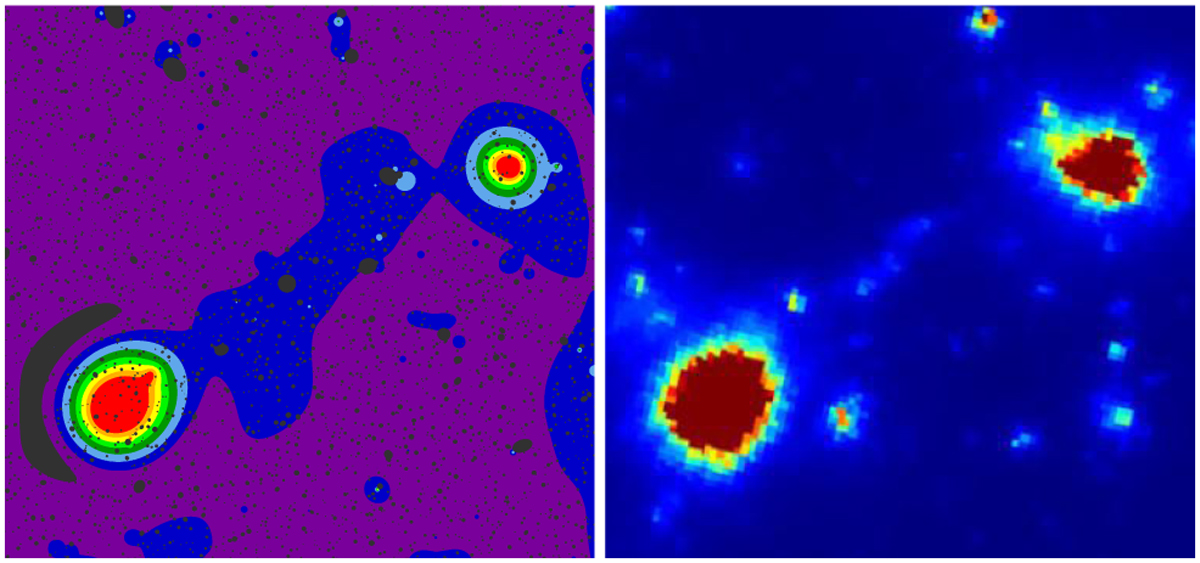
Download original image
Comparison of data and simulation. Left: eRASS:4 X-ray image. Right: same image section in the constrained simulation SLOW (Dolag et al. 2023; Seidel et al., in prep.) The two clusters, their ellipticities and extensions toward the filament region, and the filament itself are reprocuded in the mock observation.
Current usage metrics show cumulative count of Article Views (full-text article views including HTML views, PDF and ePub downloads, according to the available data) and Abstracts Views on Vision4Press platform.
Data correspond to usage on the plateform after 2015. The current usage metrics is available 48-96 hours after online publication and is updated daily on week days.
Initial download of the metrics may take a while.