Fig. 8
Download original image
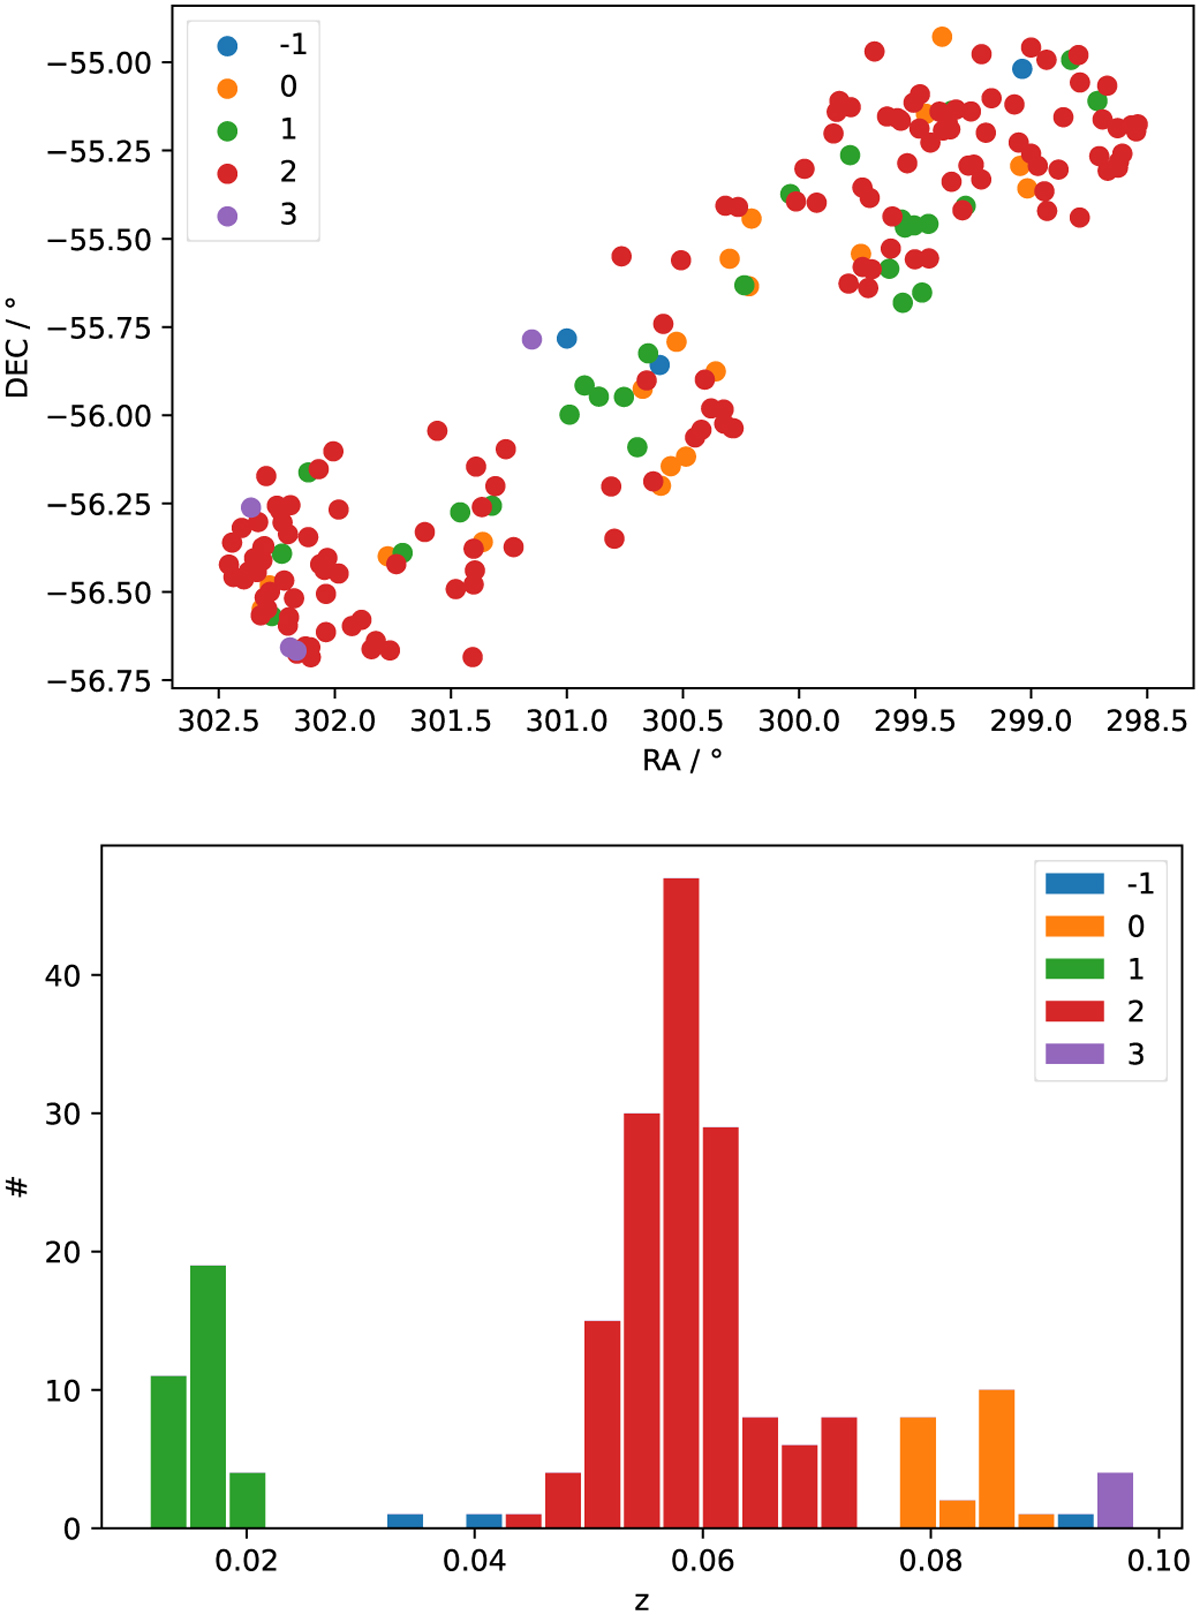
Spatial (top) and redshift (bottom) distribution of galaxies in the region of the galaxy overdensity between A3667 and A3651. The different colors (and corresponding label numbers) show categories of galaxies with a similar redshift identified with the DBSCAN algorithm. By comparing the top and bottom plots, the spatial location of galaxies with certain redshifts can be seen. Galaxies with the label −1 are outliers that could not be identified with one of the categories.
Current usage metrics show cumulative count of Article Views (full-text article views including HTML views, PDF and ePub downloads, according to the available data) and Abstracts Views on Vision4Press platform.
Data correspond to usage on the plateform after 2015. The current usage metrics is available 48-96 hours after online publication and is updated daily on week days.
Initial download of the metrics may take a while.