Fig. 7
Download original image
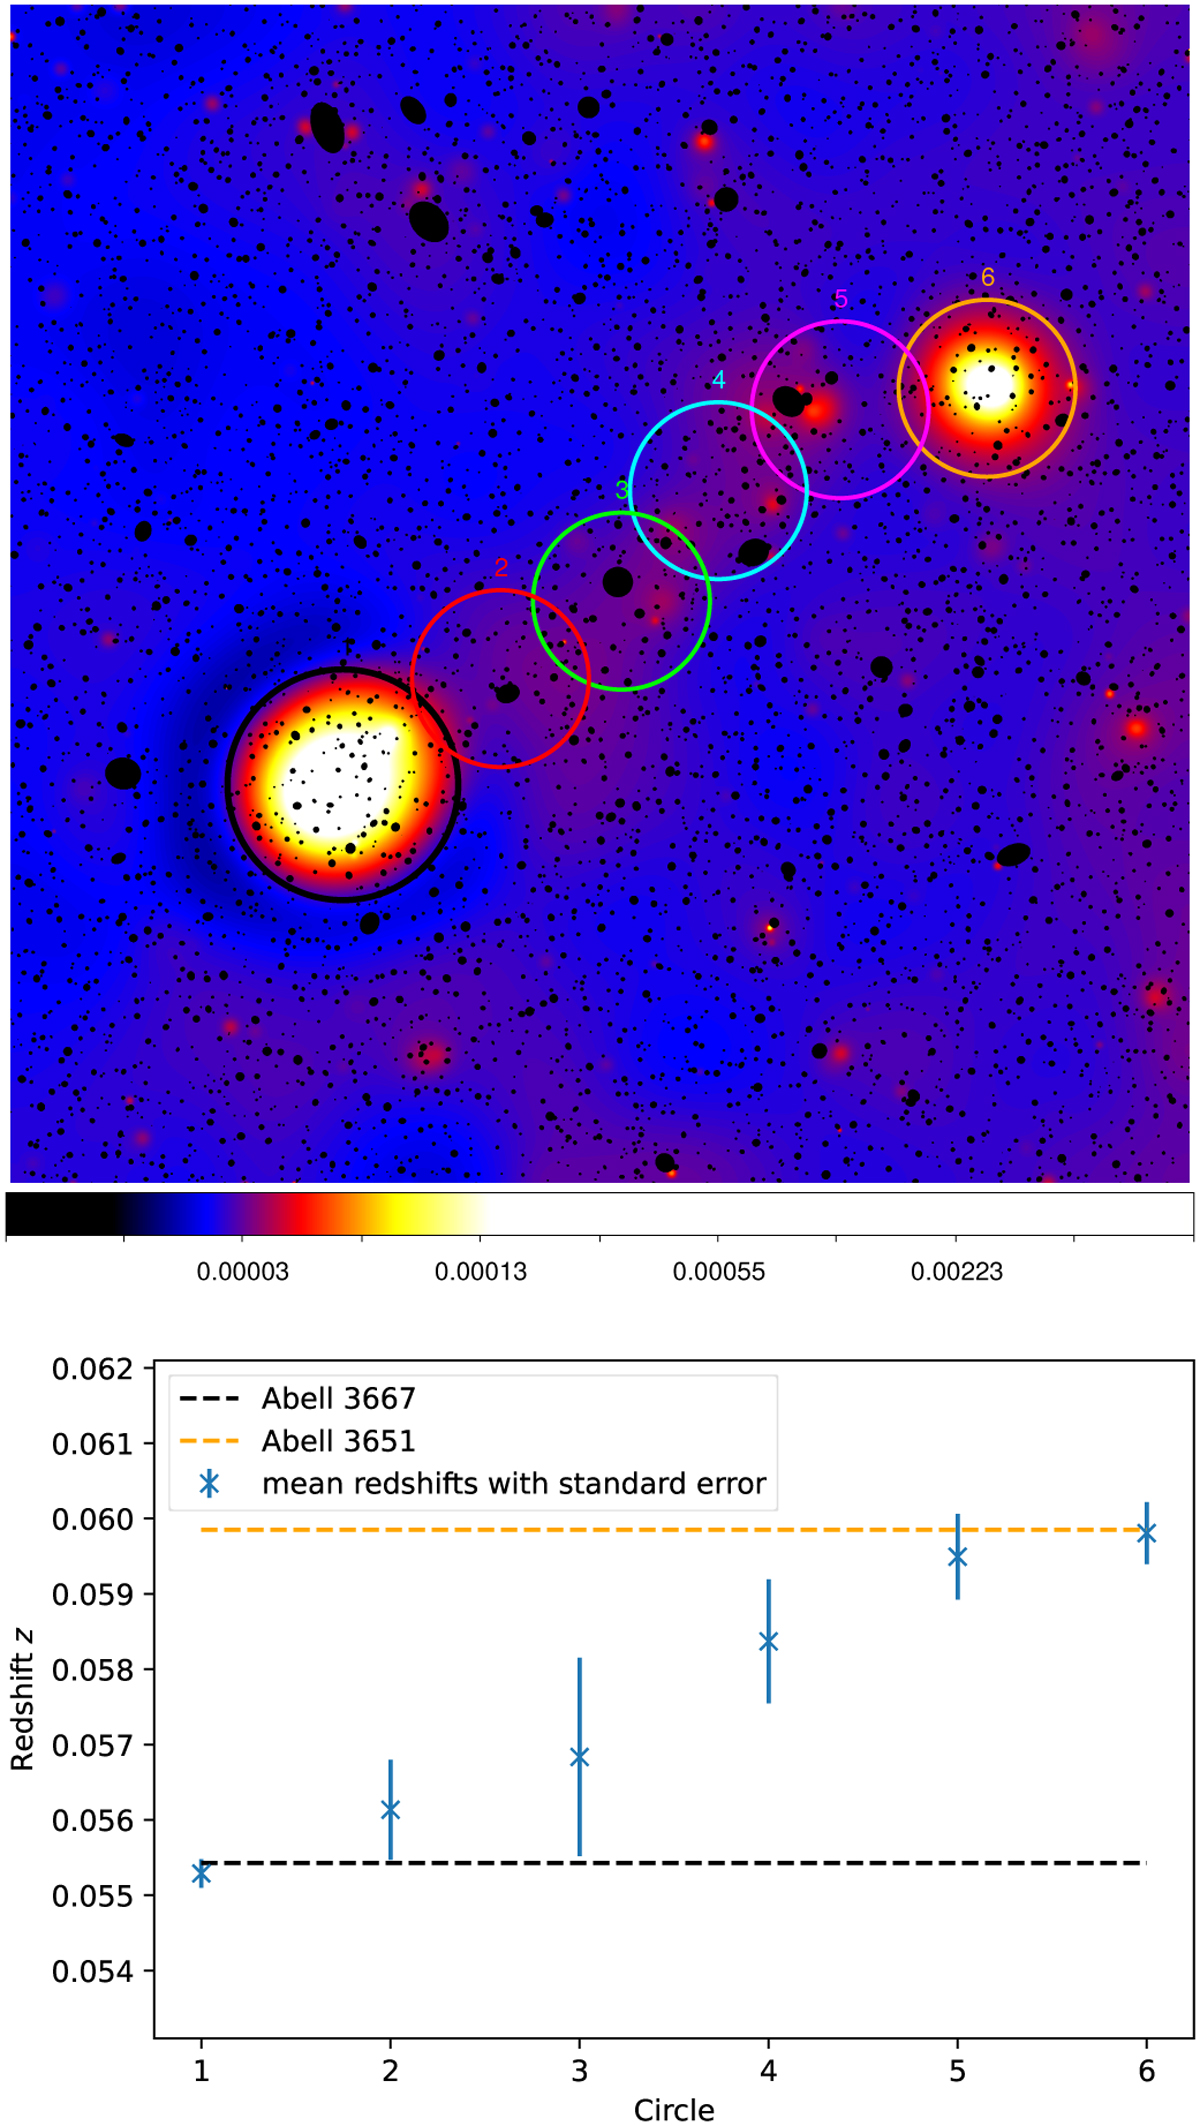
Selection and redshifts of galaxies in the filament region. Top: data-reduced and wavelet-filtered image with six circles from A3667 to A3651. The galaxies were taken from NED for each circle. The galaxies inside the circles were considered in the redshift analysis. Bottom: mean redshift of the galaxies, with close-by redshifts for each circle. A progression from the redshift of A3667 to the redshift of A3651 is visible.
Current usage metrics show cumulative count of Article Views (full-text article views including HTML views, PDF and ePub downloads, according to the available data) and Abstracts Views on Vision4Press platform.
Data correspond to usage on the plateform after 2015. The current usage metrics is available 48-96 hours after online publication and is updated daily on week days.
Initial download of the metrics may take a while.