Fig. 6
Download original image
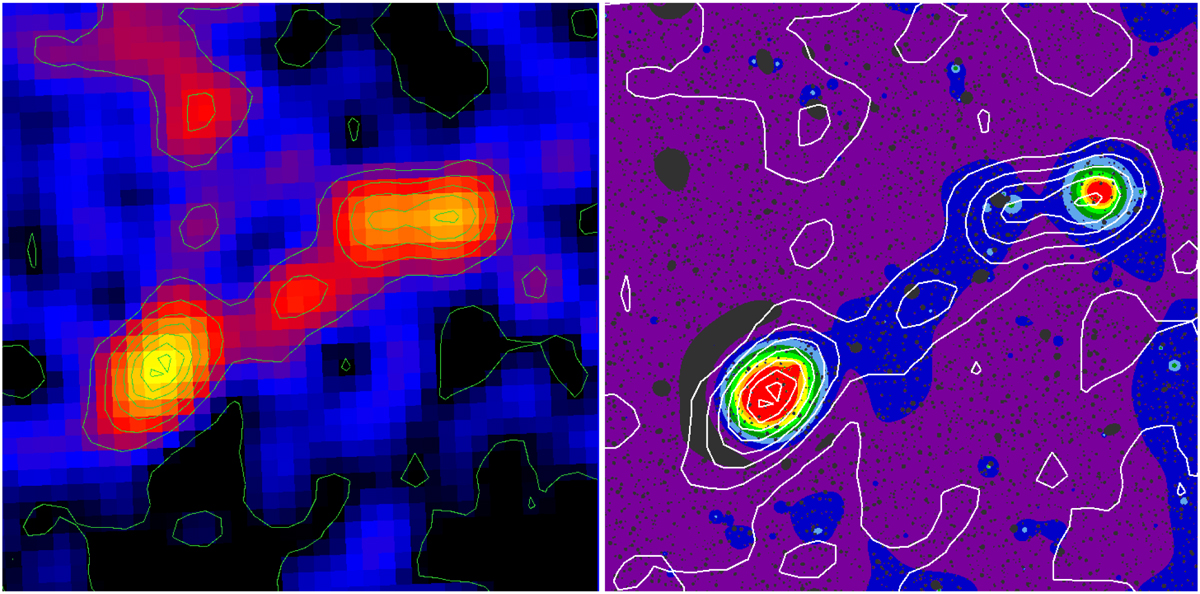
Comparison of galaxy density and X-ray emission. Left: cut and reprojected 2MASS map from Jarrett et al. (2000) and Reiprich et al. (2003) smoothed with a Gaussian kernel with a radius of 3 pixels and with green contours (contour levels are 0.18, 0.73, 1.27, 1.82, 2.36, 2.91, 3.45 and 4.00). The brighter regions can be interpreted as regions with a galaxy overdensity compared to the darker regions. Right: data-reduced waveletfiltered X-ray image overlaid with the contours from the left image. The brighter regions are regions with enhanced cluster emission compared to the darker regions.
Current usage metrics show cumulative count of Article Views (full-text article views including HTML views, PDF and ePub downloads, according to the available data) and Abstracts Views on Vision4Press platform.
Data correspond to usage on the plateform after 2015. The current usage metrics is available 48-96 hours after online publication and is updated daily on week days.
Initial download of the metrics may take a while.