Fig. 4
Download original image
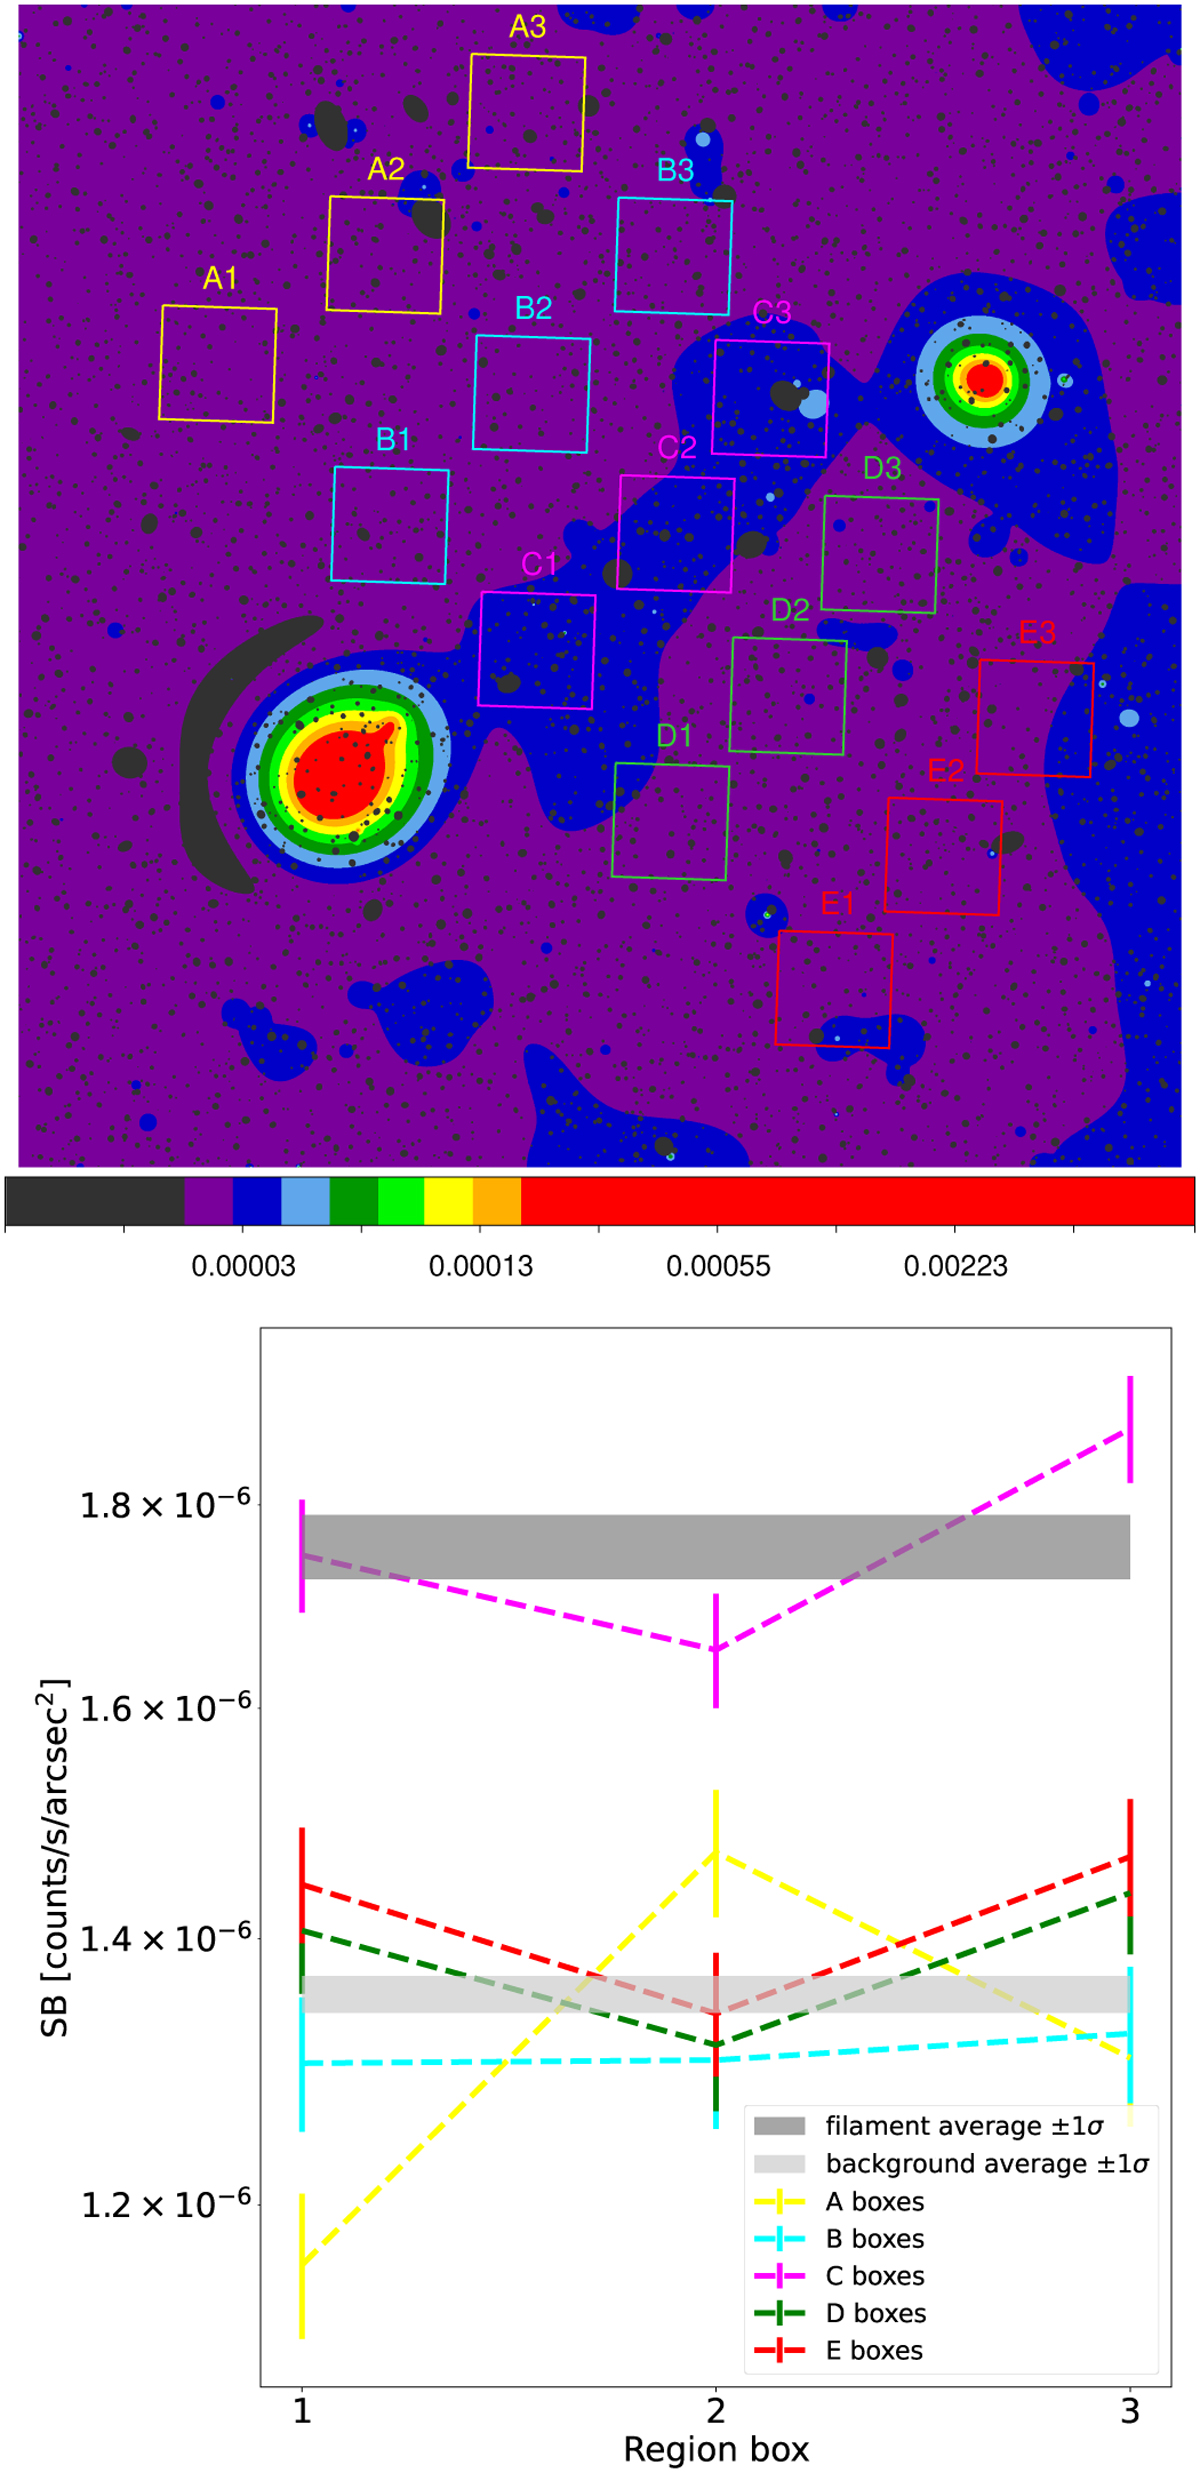
Surface brightness analysis of filament and background. Top: box placement in the wavelet-filtered image. Bottom: results of the SB analysis from the top boxes. The dashed lines between the data points are only for the purpose of better visualization and have no physical meaning. The dark gray band shows the weighted arithmetic mean with the 1 σ interval of all magenta boxes, and the light gray band shows the weighted arithmetic mean with the 1 σ interval of all background boxes.
Current usage metrics show cumulative count of Article Views (full-text article views including HTML views, PDF and ePub downloads, according to the available data) and Abstracts Views on Vision4Press platform.
Data correspond to usage on the plateform after 2015. The current usage metrics is available 48-96 hours after online publication and is updated daily on week days.
Initial download of the metrics may take a while.