Open Access
Fig. C.1
Download original image
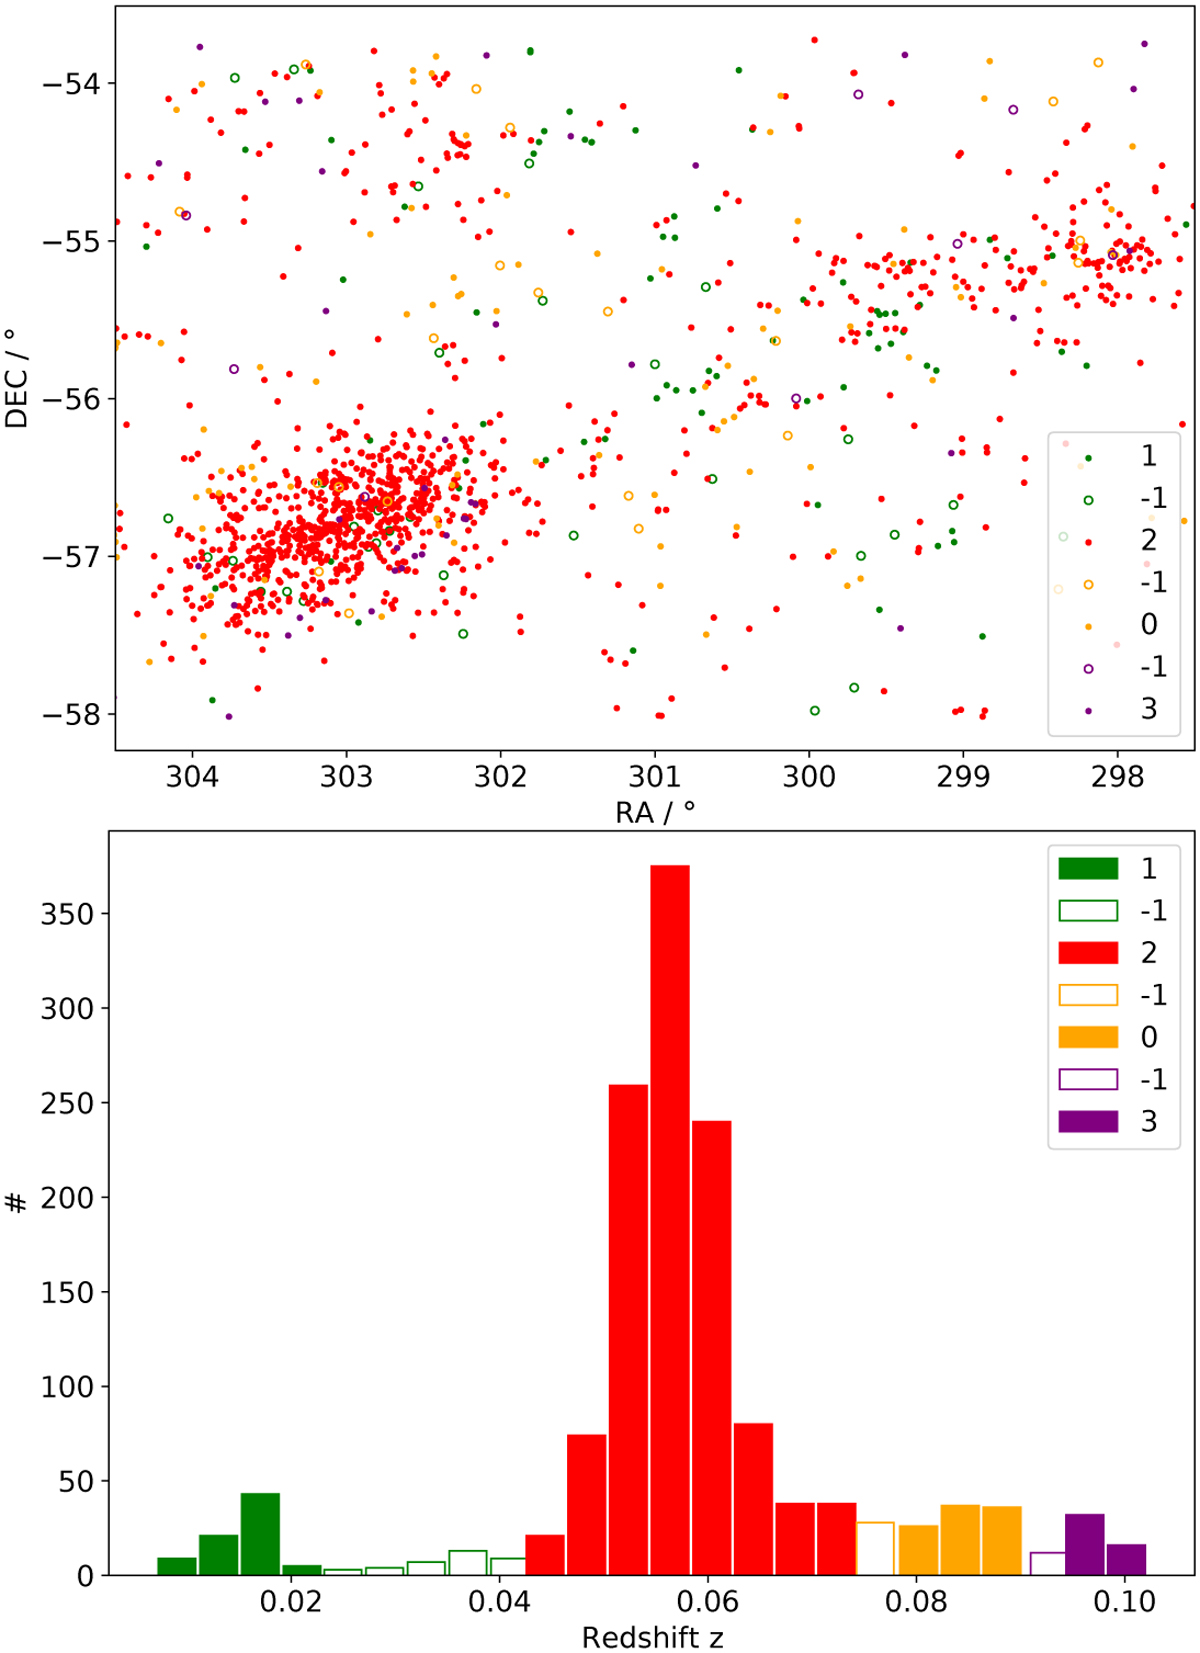
Spatial (top) and redshift (bottom) distribution of galaxies in the whole FoV. By comparing the plots in the top and bottom panel it can be seen where galaxies with certain redshifts are located spatially. For information about the colors and labels see Sect. 3.2.3 and Appendix C.
Current usage metrics show cumulative count of Article Views (full-text article views including HTML views, PDF and ePub downloads, according to the available data) and Abstracts Views on Vision4Press platform.
Data correspond to usage on the plateform after 2015. The current usage metrics is available 48-96 hours after online publication and is updated daily on week days.
Initial download of the metrics may take a while.