Fig. 10
Download original image
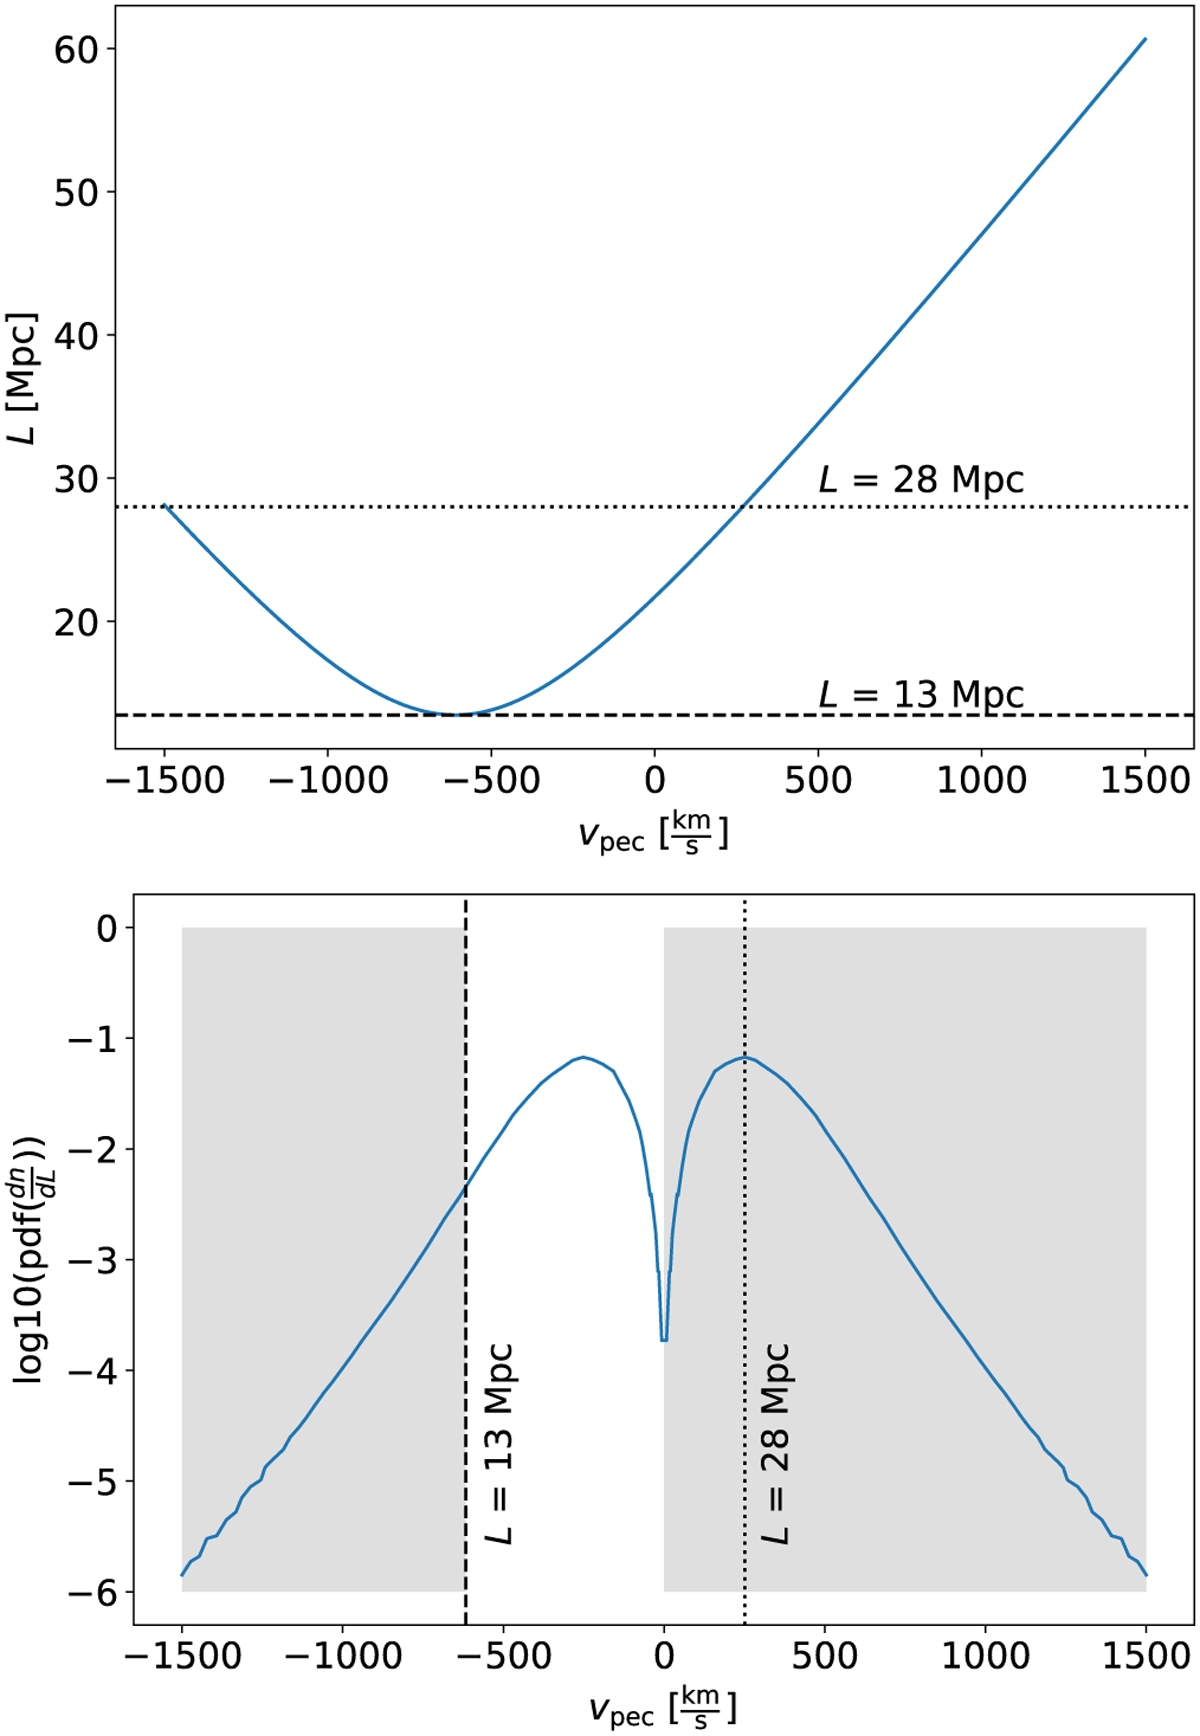
Impact of peculiar velocity on the filament length. Top: filament length L in dependence of the line-of-sight peculiar velocity vpec of one cluster. Bottom: probability density function for L as a function of vpec. The shaded gray regions show velocity ranges in which the clusters move toward each other. The minimum and most probable lengths are highlighted.
Current usage metrics show cumulative count of Article Views (full-text article views including HTML views, PDF and ePub downloads, according to the available data) and Abstracts Views on Vision4Press platform.
Data correspond to usage on the plateform after 2015. The current usage metrics is available 48-96 hours after online publication and is updated daily on week days.
Initial download of the metrics may take a while.