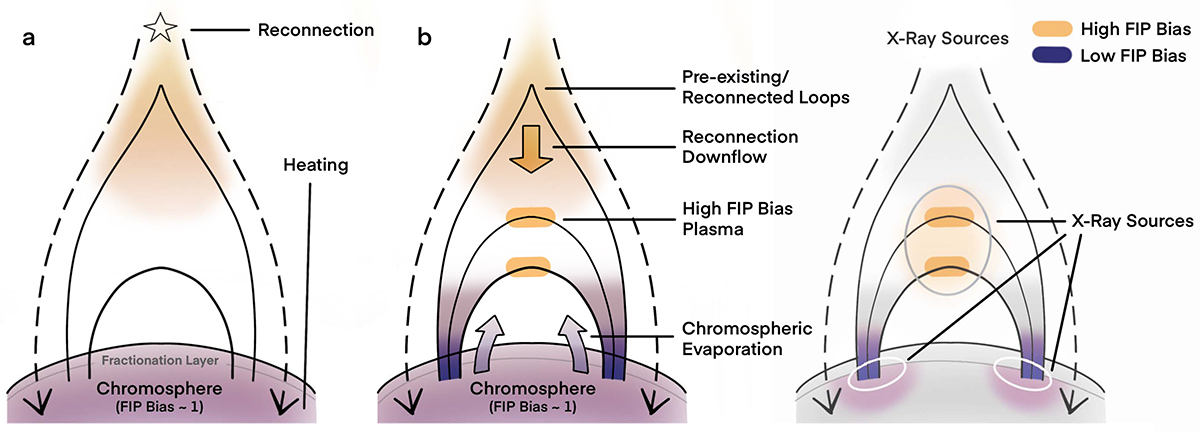
Fig. 4.
Download original image
Illustration of the plasma downflow: The orange and purple colors indicate high (coronal) and low (photospheric) FIP biases, respectively. The chromosphere is broadly defined to have a FIP bias of ∼1 for illustration purposes. (a) The impulsive phase of a flare – reconnection in the current sheet leads to heating and particle acceleration that travels to the chromosphere, heating up the chromosphere below the fractionation layer. (b) Chromospheric plasma with a low FIP bias, or even an inverse-FIP bias evaporates (ablates) upward due to the increase in temperature, filling the bottom part of flare loops with chromospheric plasma. At the same time, pre-existing loops with a high FIP bias reconnect at the current sheet, creating an outflow of high FIP bias plasma that stays at the loop top, possibly confined by evaporation or ablation upflows from both footpoints. The rightmost figure illustrates that X-ray emissions at the loop top (high FIP bias) and two loop footpoints sources (low FIP bias). In Sun-as-a-star measurements, the loop top high FIP bias is likely diluted due to the bright low FIP bias loop footpoints, which dominate.
Current usage metrics show cumulative count of Article Views (full-text article views including HTML views, PDF and ePub downloads, according to the available data) and Abstracts Views on Vision4Press platform.
Data correspond to usage on the plateform after 2015. The current usage metrics is available 48-96 hours after online publication and is updated daily on week days.
Initial download of the metrics may take a while.