Fig. 2.
Download original image
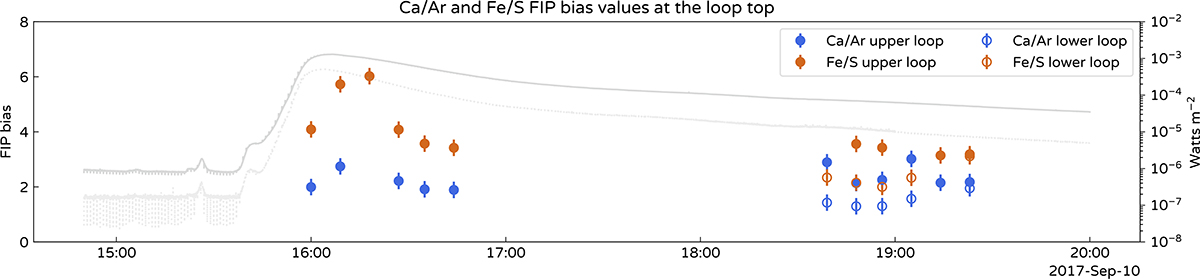
Ca/Ar and Fe/S FIP bias over time. The blue and orange dots indicate FIP bias calculated using the Ca XIV 193.87 Å/Ar XIV 194.40 Å and Fe XVI 262.98 Å/S XIII 256.69 Å diagnostics, respectively. Vertical bar at each data point indicates an uncertainty of 0.3. Only data points with sufficient χ2 and good fits are included. The solid and hollow styles indicate composition values calculated using the upper and lower loops, respectively. The lower set of loops can only be identified in the later six rasters. Grey line indicates the GOES X-ray lightcurve of the flare. It is worth noting that recent temporally resolved Sun-as-a-star observations commonly show a decline in FIP bias during flare peaks, contrasting the trend observed in this figure.
Current usage metrics show cumulative count of Article Views (full-text article views including HTML views, PDF and ePub downloads, according to the available data) and Abstracts Views on Vision4Press platform.
Data correspond to usage on the plateform after 2015. The current usage metrics is available 48-96 hours after online publication and is updated daily on week days.
Initial download of the metrics may take a while.