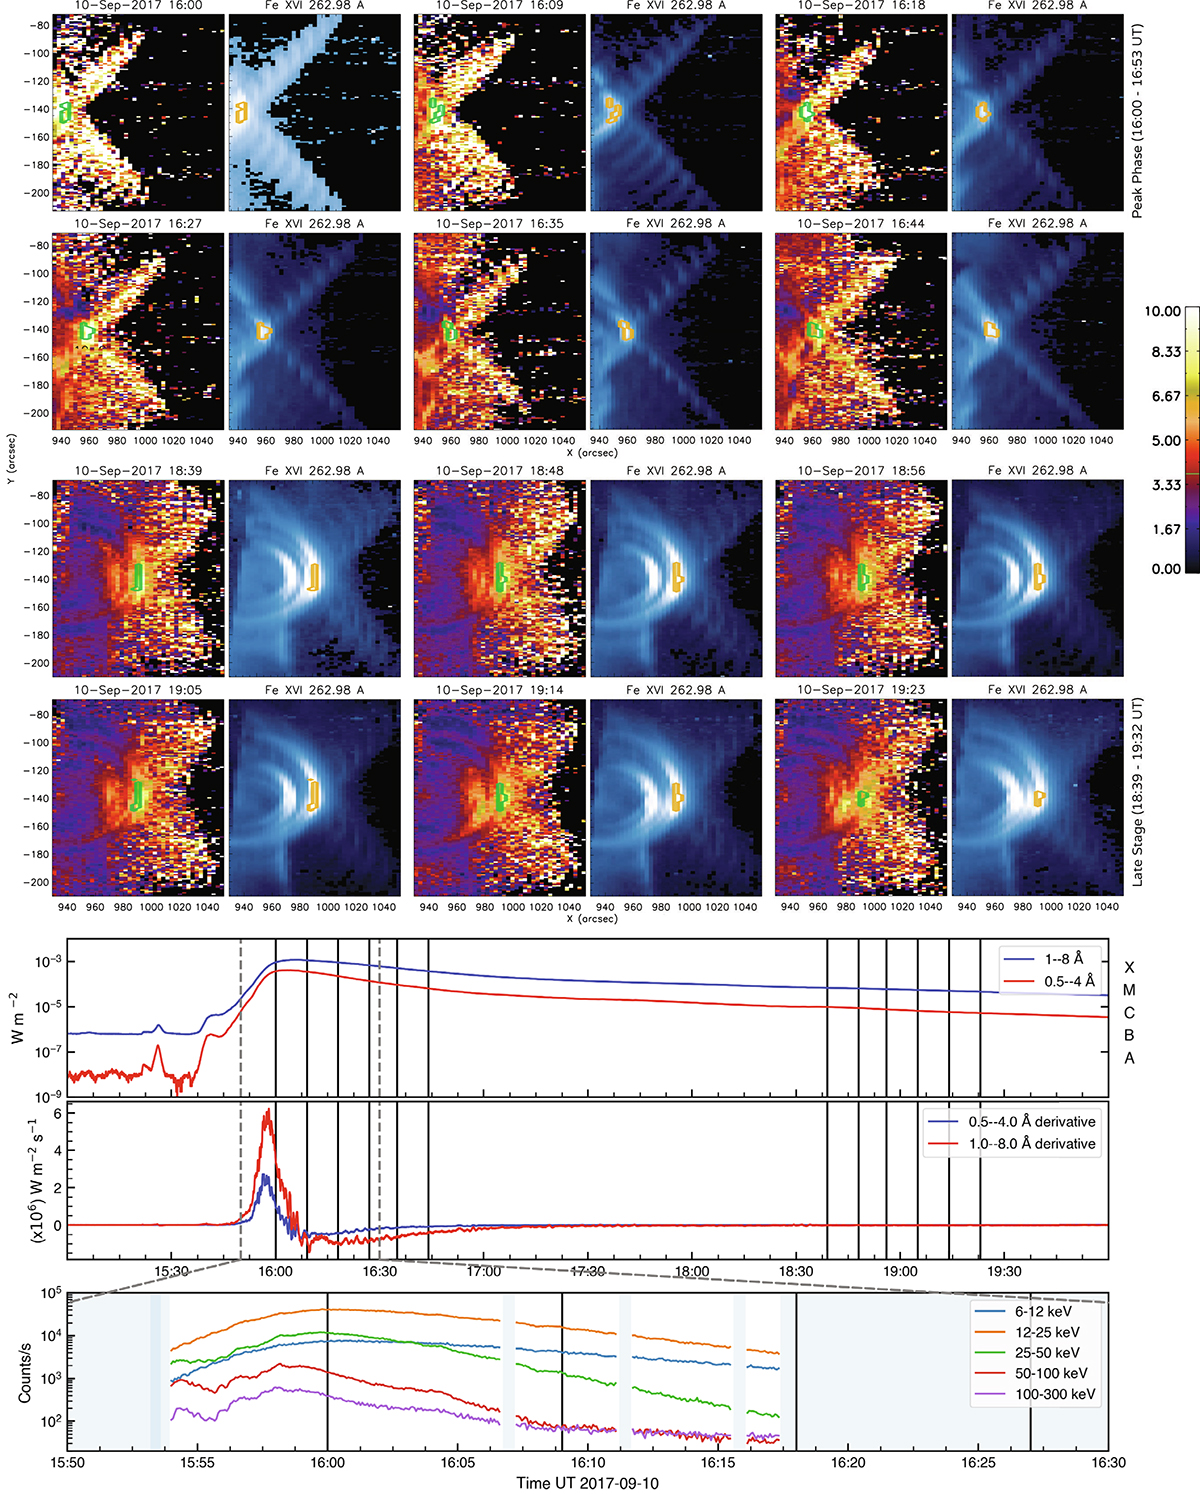
Fig. 1.
Download original image
Evolution of the 2017 September 10 X8.2 flare in the peak phase (16:00–16:53 UT) and late stage (18:39–19:32 UT). The upper panel shows Ca XIV 193.87 Å/Ar XIV 194.40 Å intensity ratio (left) and Fe XVI 262.98 Å (right) intensity maps during the peak phase (16:00–16:53 UT) and late stage (18:39–19:32 UT) of the 2017 September 10 X8.2 flare. The following horizontal panels shows from top to bottom, the GOES X-ray lightcurve of the flare – 1–8 Å flux (blue); and the 0.5–4 Å flux (red); the GOES lightcurve derivative (i.e. following the Neupert effect Neupert 1968) and RHESSI light curves in five energy bands, showing the X-ray evolution during the first 40 minutes. The shaded out regions in the RHESSI plot denote times when RHESSI was in nighttime or travelling through the South Atlantic Anomaly (SAA) or when the attenuator was changing. Each vertical black line indicate the starting times of a EIS raster. The upper Ca/Ar intensity ratio maps are saturated at 10 – bright orange or yellow indicates a coronal abundance, and cooler colours like dark blue indicate close to photospheric abundances. It is clear that a coronal abundance is observed at the loop apex across all maps, with photospheric abundances toward the loop footpoints. Green or orange contours indicate the brightest regions in the Fe XVI 262.98 Å intensity maps at each corresponding time. Fe XVI 262.98 Å has a formation temperature at log T = 6.44 K, similar to the Ca XIV 193.87 Å and Ar XIV 194.40 Å lines used.
Current usage metrics show cumulative count of Article Views (full-text article views including HTML views, PDF and ePub downloads, according to the available data) and Abstracts Views on Vision4Press platform.
Data correspond to usage on the plateform after 2015. The current usage metrics is available 48-96 hours after online publication and is updated daily on week days.
Initial download of the metrics may take a while.