Fig. 9
Download original image
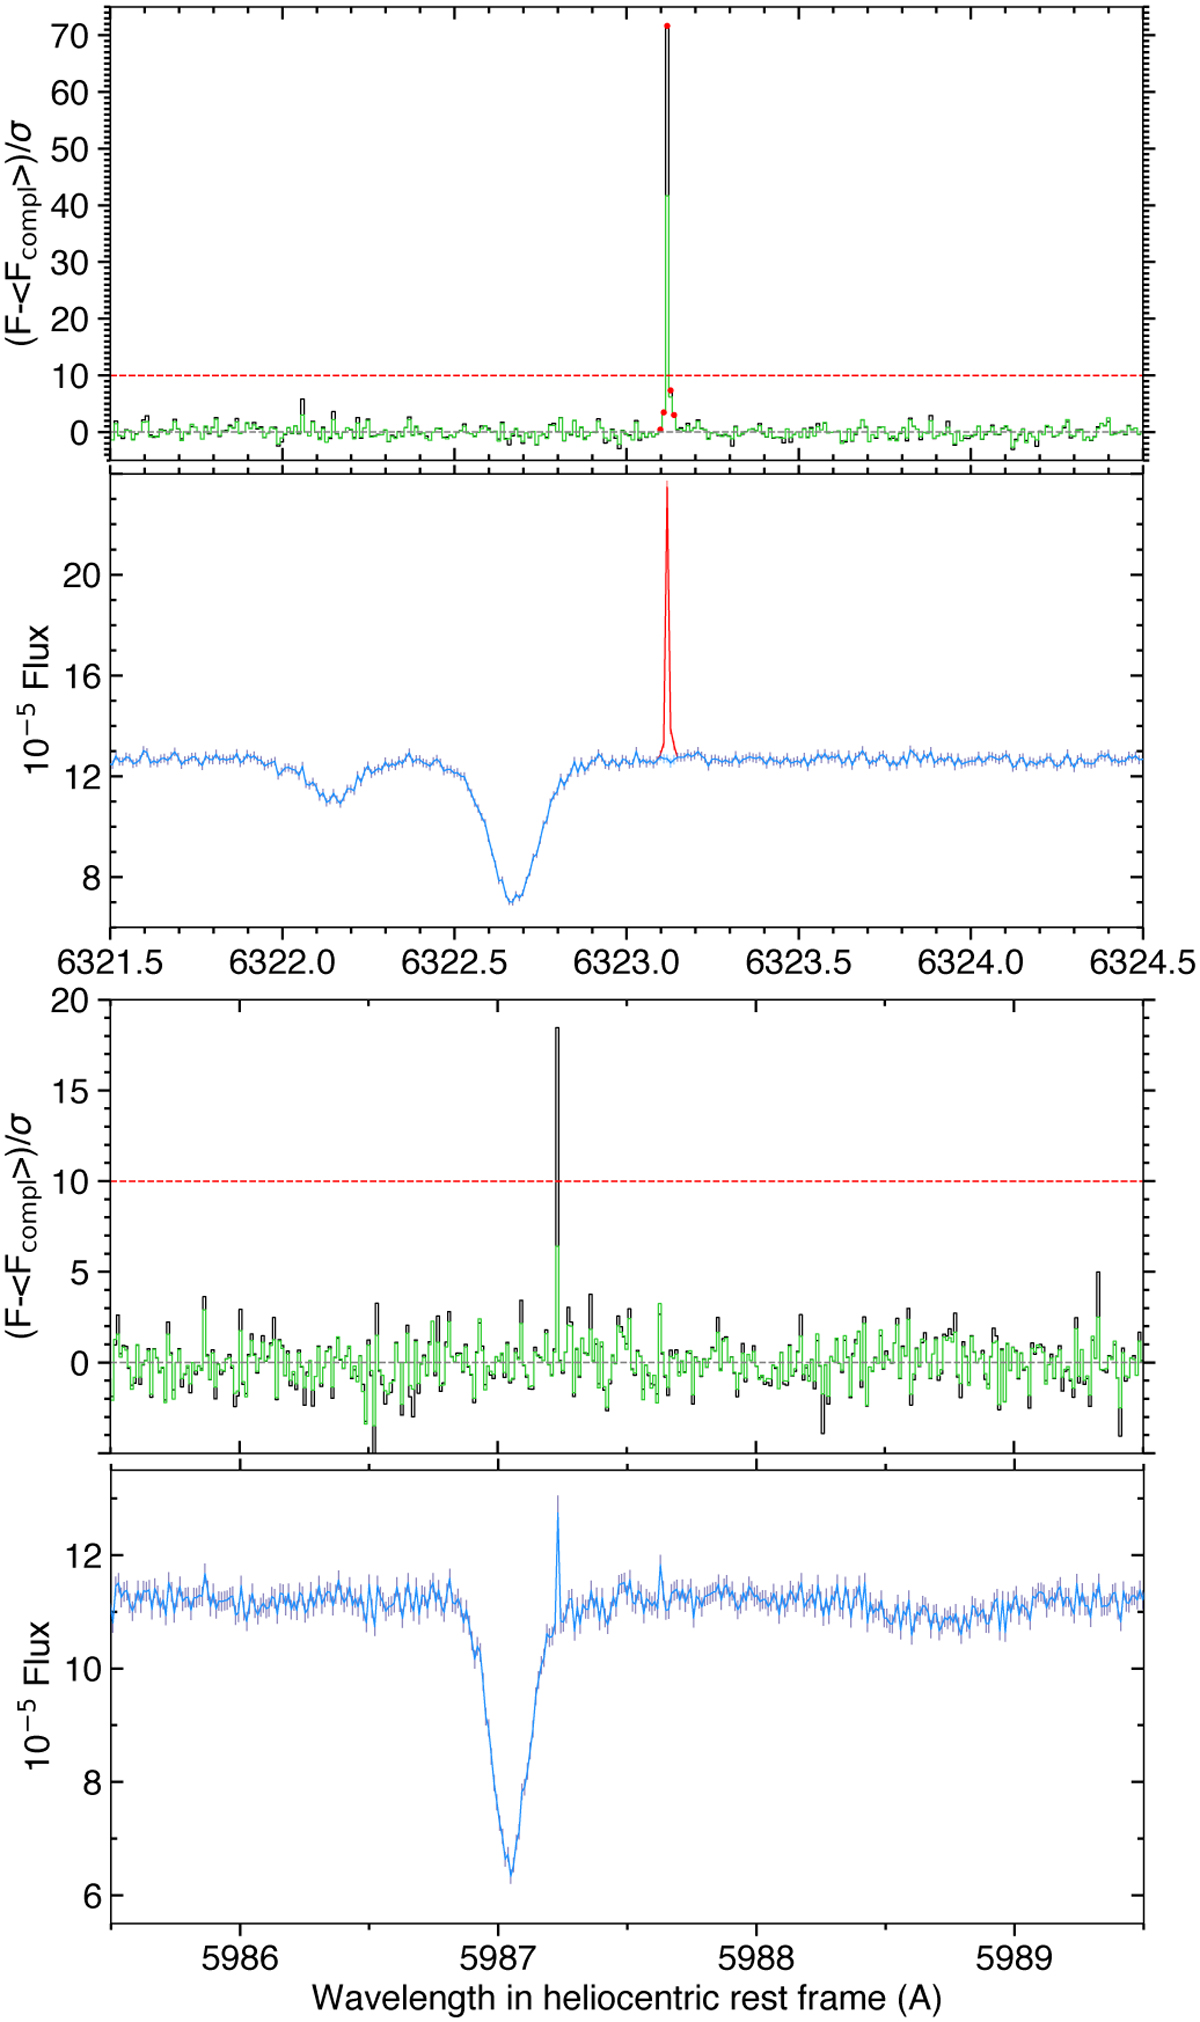
Cosmics processing applied to epoch 2 of WASP-76. Top subpanels show F(t) – Fcomp divided by σFcomp (black) and σmeas(t) (green), with αcosm plotted as a red line, in a sample exposure whose flux spectrum is shown in the bottom subpanels. The red pixel in the top block (together with adjacent pixels) is corrected because it deviates with respect to both its own uncertainty and to the standard deviation over adjacent exposures. The pixel in the bottom block is not corrected because it could result from photon noise in the exposure.
Current usage metrics show cumulative count of Article Views (full-text article views including HTML views, PDF and ePub downloads, according to the available data) and Abstracts Views on Vision4Press platform.
Data correspond to usage on the plateform after 2015. The current usage metrics is available 48-96 hours after online publication and is updated daily on week days.
Initial download of the metrics may take a while.