Fig. 7
Download original image
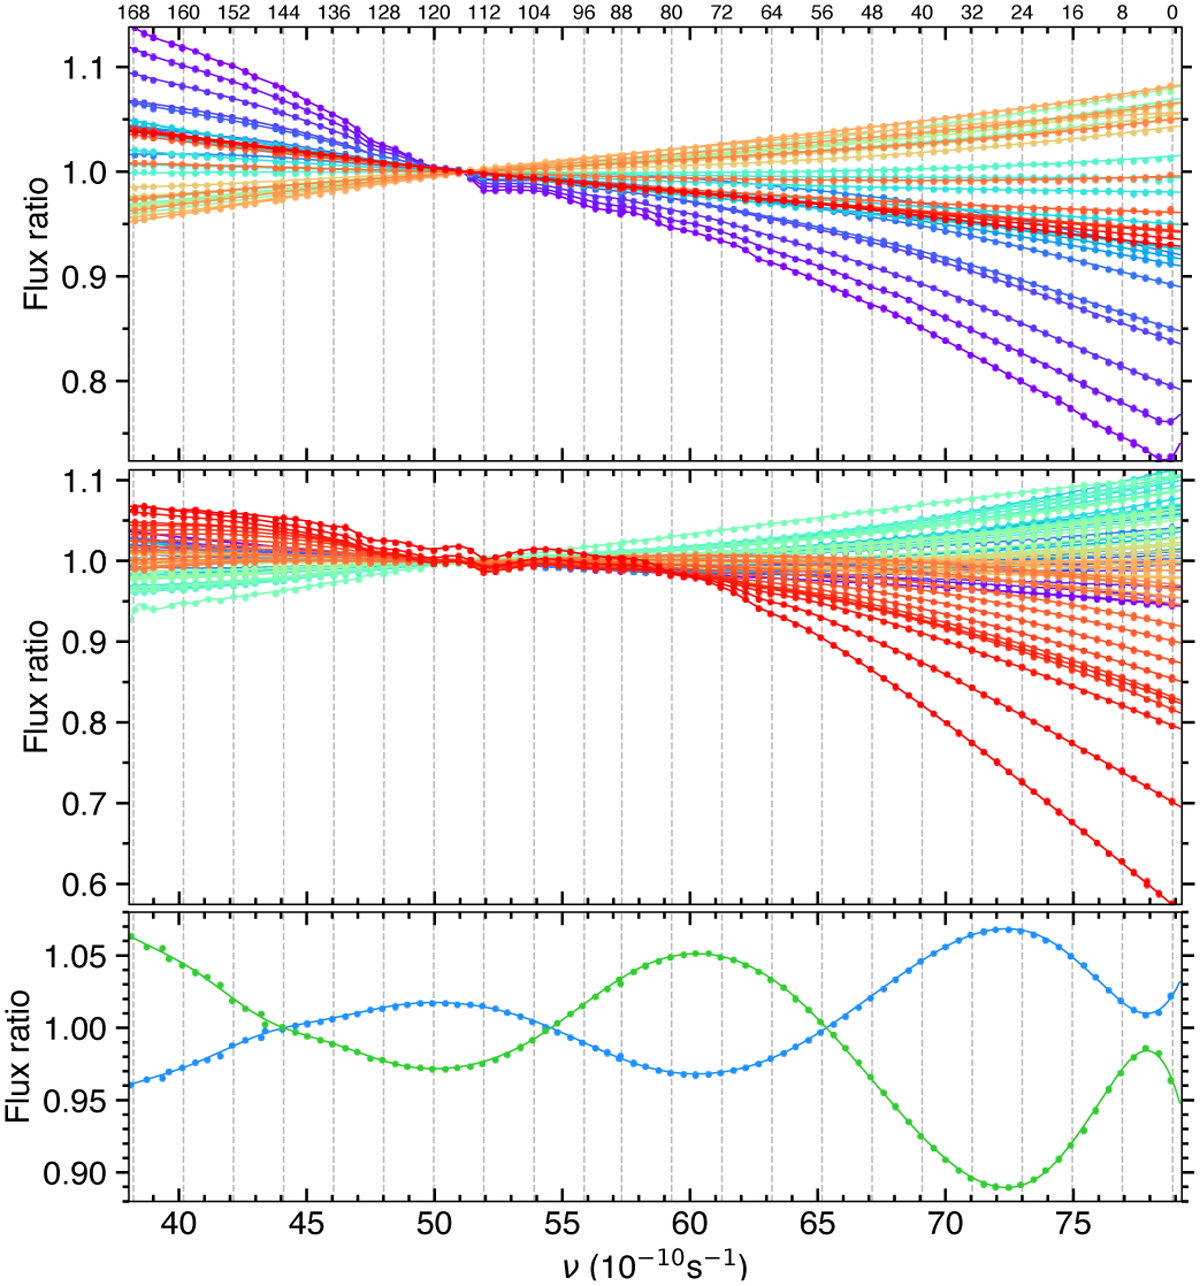
Flux balance variations in WASP-76 spectra, between each exposure and their median reference in epoch 1 (top panel) and 2 (middle panel), and between the median reference and their mean over both epochs (bottom panel). Disks show the spectra-to-reference ratios measured at low spectral resolution in each exposure (top and middle panels, colored from purple to red over the rainbow scale with increasing orbital phase) or in each epoch (bottom panel, in blue for epoch 1 and green for epoch 2). Solid lines with matching colors show their bestfit models. Vertical dashed grey lines indicate the central position of one in every eight ESPRESSO slice. The medium-frequency variations captured around slice 120 are observed at high airmass and might correspond to the ozone Chappuis absorption bands at λ = 5750 and 6030 Å (ν = 52.1 and 49.7×10⁻¹⁰ s−1).
Current usage metrics show cumulative count of Article Views (full-text article views including HTML views, PDF and ePub downloads, according to the available data) and Abstracts Views on Vision4Press platform.
Data correspond to usage on the plateform after 2015. The current usage metrics is available 48-96 hours after online publication and is updated daily on week days.
Initial download of the metrics may take a while.