Fig. 6
Download original image
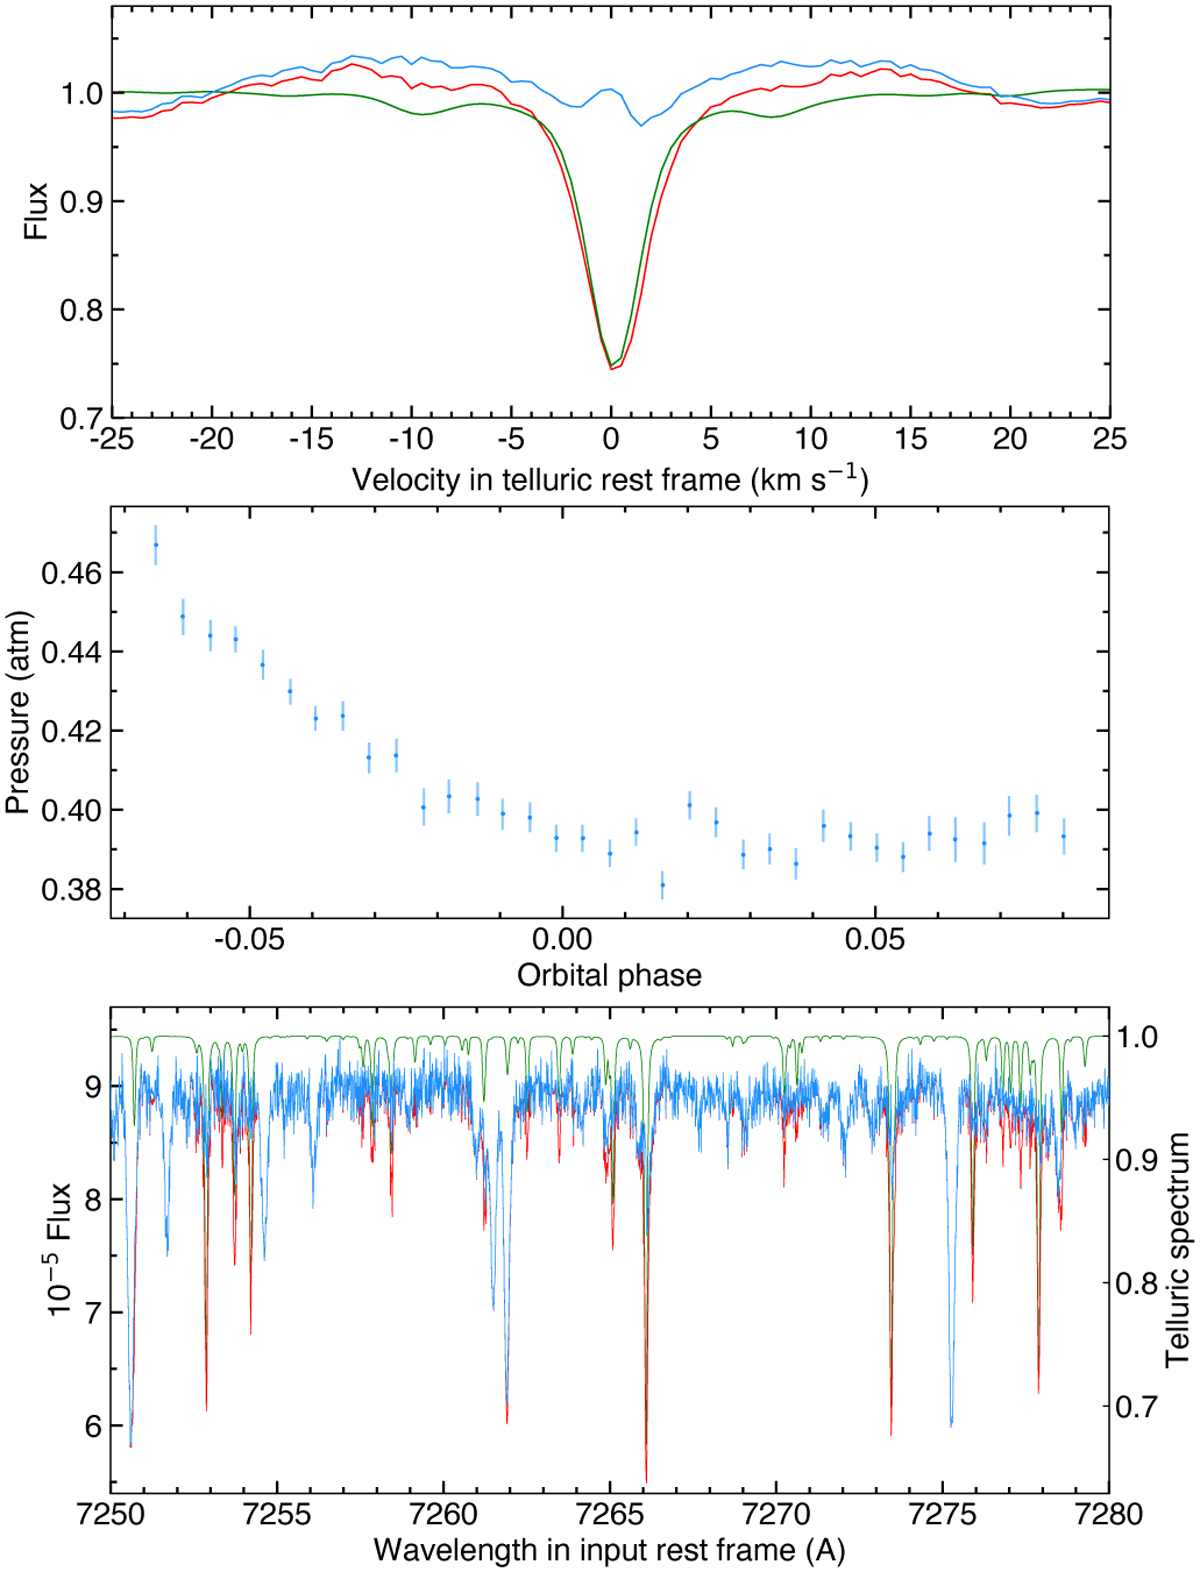
Telluric correction for WASP-76 epoch 1. Top panel: CCF of H2O over the telluric lines used in the fit, from an observed spectrum before (red) and after (blue) correction, and from its best-fit telluric spectrum (green). Middle panel: Average atmospheric pressures derived for H2O over the epoch. Bottom panel: Spectrum of the exposure in the top panel, before (red) and after (blue) correction, with its best-fit telluric model (green).
Current usage metrics show cumulative count of Article Views (full-text article views including HTML views, PDF and ePub downloads, according to the available data) and Abstracts Views on Vision4Press platform.
Data correspond to usage on the plateform after 2015. The current usage metrics is available 48-96 hours after online publication and is updated daily on week days.
Initial download of the metrics may take a while.