Fig. 5
Download original image
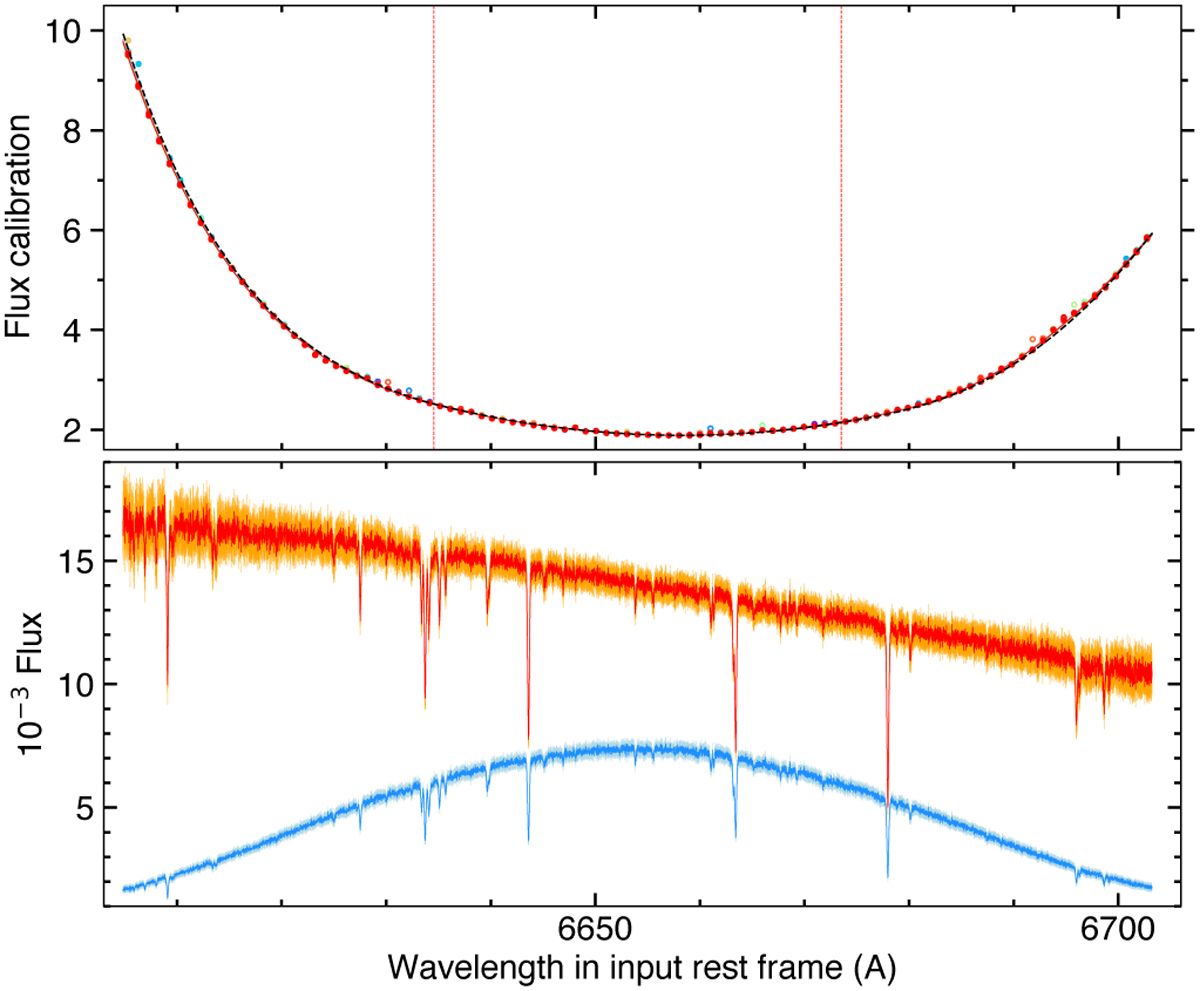
Flux calibration. Top panel: disks (colored over the rainbow scale as a function of orbital phase, but mostly identical) show the ![]() values measured at low spectral resolution in a given order, for all exposures of WASP-76 epoch 2. The black dashed line shows the median profile <g>cal over both epochs. Dotted vertical lines indicate where the three piece-wise polynomials join. Bottom panel: spectrum measured during one of WASP-76 epoch 2 exposure, scaled back from the DRS calibrated counts (red, with orange uncertainties) to ANTARESS equivalent raw counts (blue, with light blue uncertainties). Plotted uncertainties are amplified by three to visualize the difference in relative errors between the order edge and center.
values measured at low spectral resolution in a given order, for all exposures of WASP-76 epoch 2. The black dashed line shows the median profile <g>cal over both epochs. Dotted vertical lines indicate where the three piece-wise polynomials join. Bottom panel: spectrum measured during one of WASP-76 epoch 2 exposure, scaled back from the DRS calibrated counts (red, with orange uncertainties) to ANTARESS equivalent raw counts (blue, with light blue uncertainties). Plotted uncertainties are amplified by three to visualize the difference in relative errors between the order edge and center.
Current usage metrics show cumulative count of Article Views (full-text article views including HTML views, PDF and ePub downloads, according to the available data) and Abstracts Views on Vision4Press platform.
Data correspond to usage on the plateform after 2015. The current usage metrics is available 48-96 hours after online publication and is updated daily on week days.
Initial download of the metrics may take a while.