Fig. G.6
Download original image
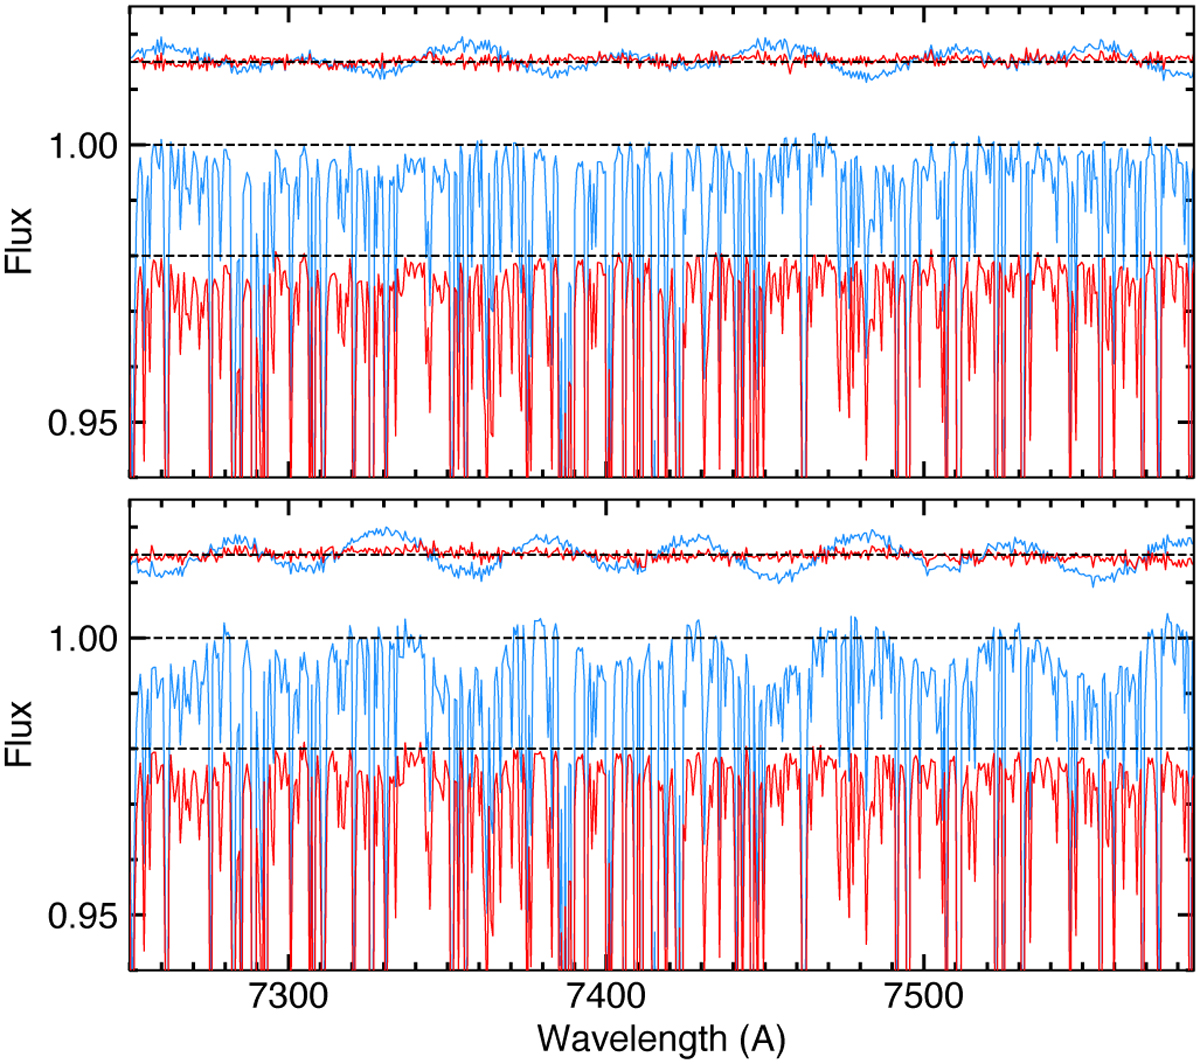
Wiggle correction in epoch 1 of HD 209458b, for exposures at index 60 (top panel) and 88 (bottom panel). Blue and red profiles show spectra before and after correction, respectively. Flux spectra are normalized by the stellar continuum (estimated from the corrected data; Sect. 7.1) and offset for clarity. The dashed black line represents the normalized continuum unity. Transmission spectra, shown at the top of the panels and calculated with the master out-of-transit spectrum, highlight wiggle patterns strong enough to be visible in the flux spectra.
Current usage metrics show cumulative count of Article Views (full-text article views including HTML views, PDF and ePub downloads, according to the available data) and Abstracts Views on Vision4Press platform.
Data correspond to usage on the plateform after 2015. The current usage metrics is available 48-96 hours after online publication and is updated daily on week days.
Initial download of the metrics may take a while.