Fig. G.4
Download original image
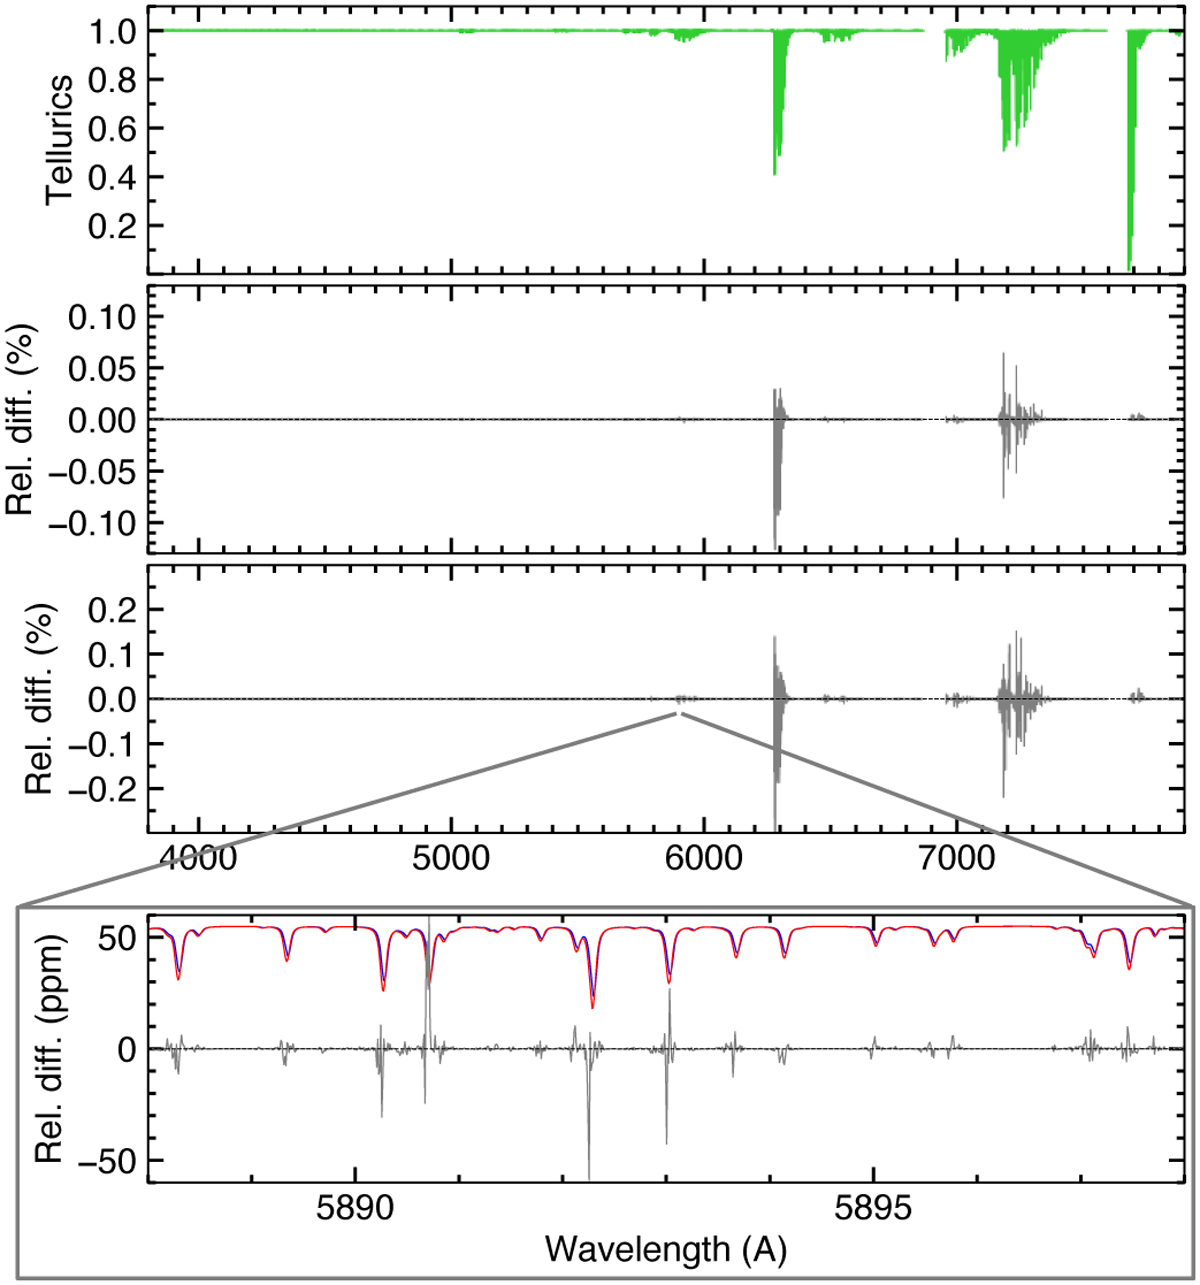
Weighing performance (tellurics) for disk-integrated spectra. First (top) panel: Typical telluric spectrum in HD 209458 epoch 1. Second panel: Relative difference between the master-out spectra accounting or not for telluric correction in weight profiles. Third panel: Same as the second panel, when averaging only two exposures (index 5 and 84). Fourth (bottom) panel: Zoom from the third panel in the region of the sodium doublet, illustrating how shifting telluric lines (reported on an arbitrary scale, in blue and red at indexes 5 and 84) bias the mean over the pixels they absorb when not included in weight profiles.
Current usage metrics show cumulative count of Article Views (full-text article views including HTML views, PDF and ePub downloads, according to the available data) and Abstracts Views on Vision4Press platform.
Data correspond to usage on the plateform after 2015. The current usage metrics is available 48-96 hours after online publication and is updated daily on week days.
Initial download of the metrics may take a while.