Open Access
Fig. G.1
Download original image
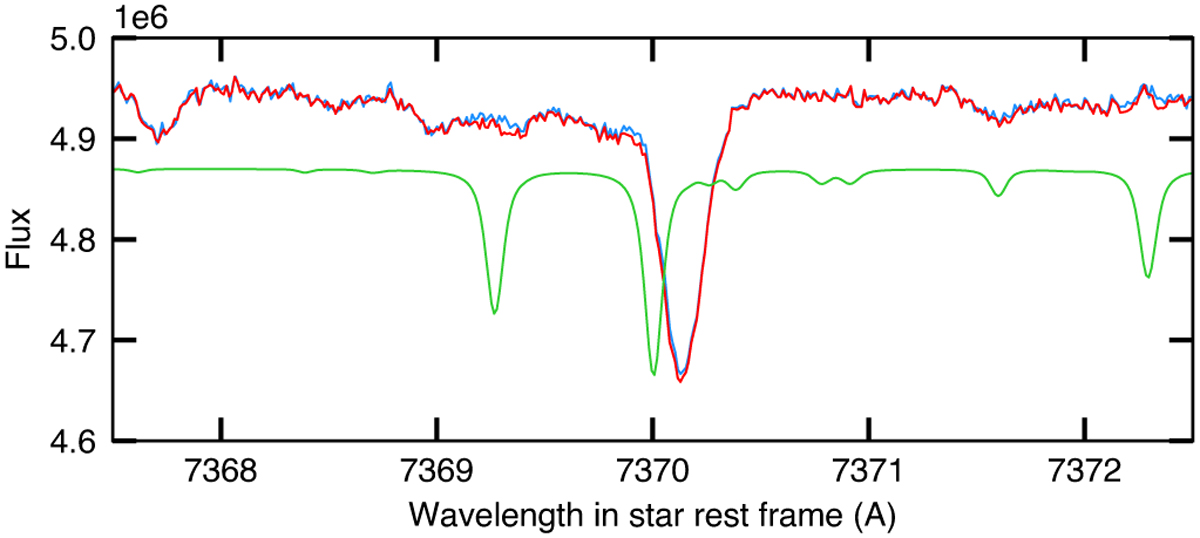
Average out-of-transit spectrum of HD 209458 (epoch 1), when resampling spectra on a common wavelength grid (red) or not (blue). In the former case, undercorrections of telluric lines (highlighted by the best-fit telluric model at mid-epoch, in green) in individual exposures add up and yield biases visible by eye.
Current usage metrics show cumulative count of Article Views (full-text article views including HTML views, PDF and ePub downloads, according to the available data) and Abstracts Views on Vision4Press platform.
Data correspond to usage on the plateform after 2015. The current usage metrics is available 48-96 hours after online publication and is updated daily on week days.
Initial download of the metrics may take a while.