Fig. F.1
Download original image
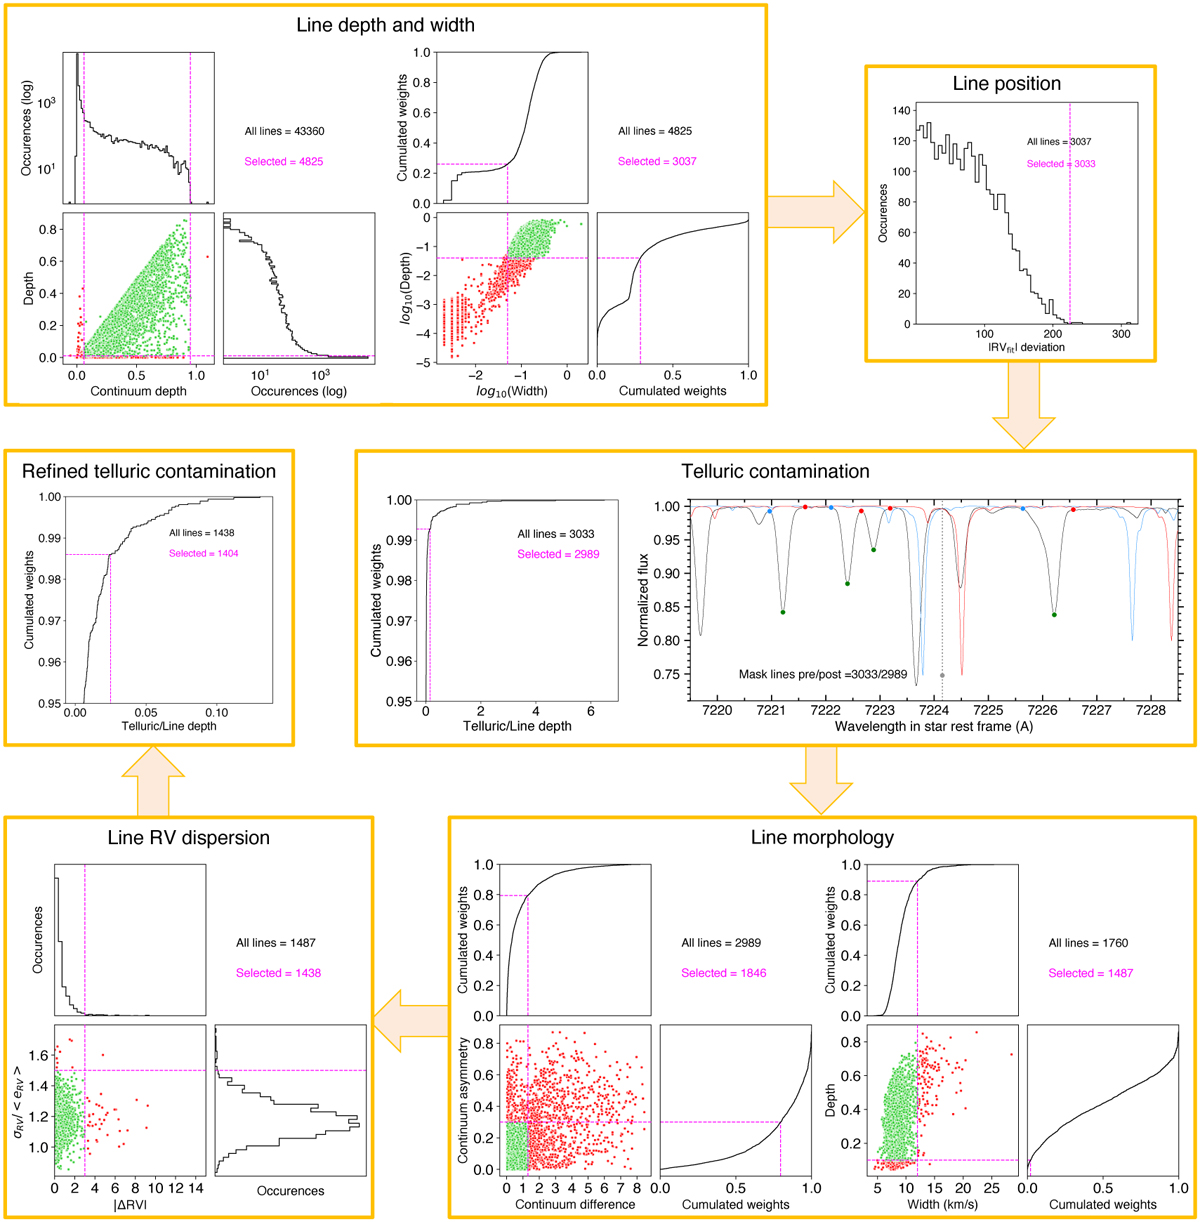
Flowchart of CCF mask generation, illustrated with HD 209458. Thresholds applied in each step (magenta lines) can be adjusted based on the resulting line selection displayed as 2D distributions (green and red disks show lines kept and excluded, respectively), occurence histograms, and cumulative functions of the line weights. We illustrate how telluric contamination is flagged by showing the master telluric spectrum at its minimum (blue) and maximum (red) doppler shifts during the two epochs, relative to the master stellar spectrum (black profile). The stellar line at ~7223.7 Å is excluded due to contamination by the telluric line highlighted at its mean position by the dashed grey line.
Current usage metrics show cumulative count of Article Views (full-text article views including HTML views, PDF and ePub downloads, according to the available data) and Abstracts Views on Vision4Press platform.
Data correspond to usage on the plateform after 2015. The current usage metrics is available 48-96 hours after online publication and is updated daily on week days.
Initial download of the metrics may take a while.