Fig. C.4
Download original image
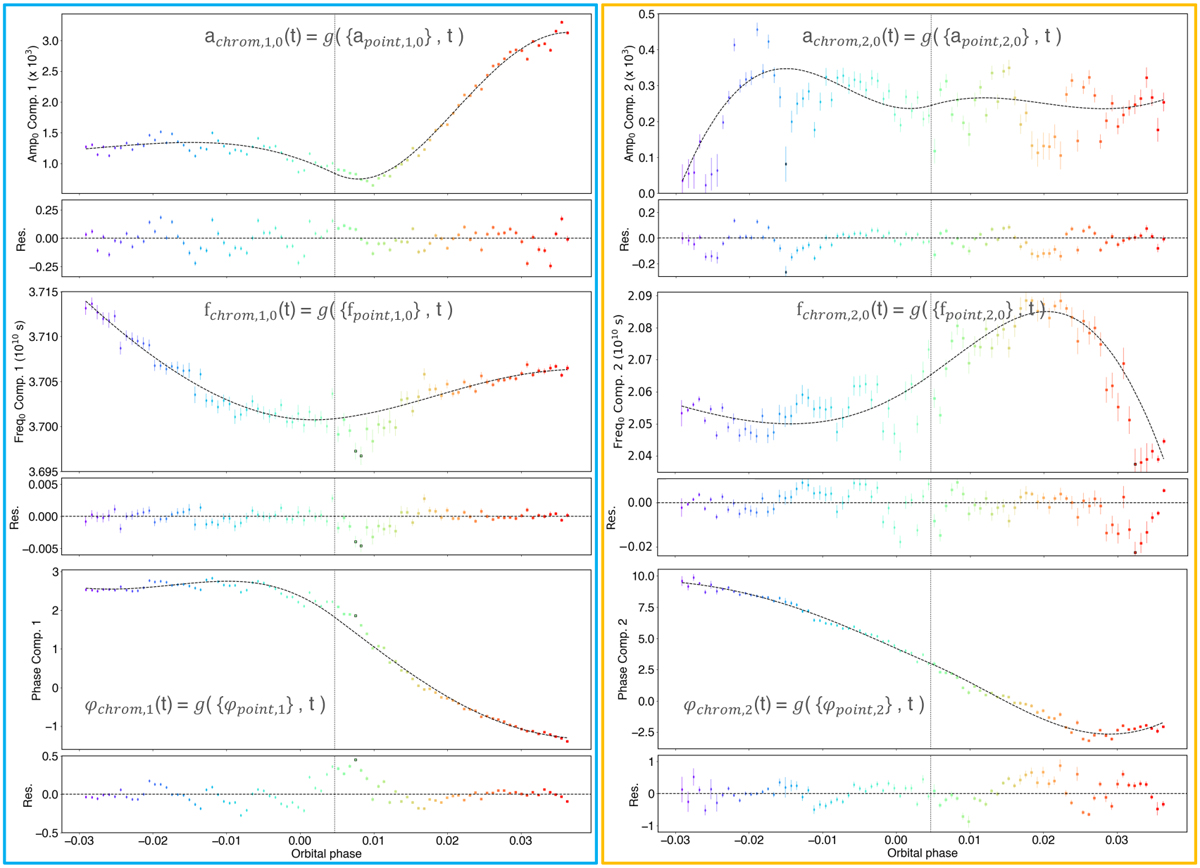
Pointing analysis. Diamonds (resp. squares) show the chromatic amplitude (top), frequency (middle) and phase (bottom) coefficients derived east (resp. west) of the meridian from the fit to individual exposures, plotted as a function of orbital phase. The meridian crossing is indicated as a vertical dotted line. Bottom subpanels show residuals between the measurements and their best-fit pointing coordinate model (dashed black curves). The blue and orange boxes correspond to the first and second wiggle components.
Current usage metrics show cumulative count of Article Views (full-text article views including HTML views, PDF and ePub downloads, according to the available data) and Abstracts Views on Vision4Press platform.
Data correspond to usage on the plateform after 2015. The current usage metrics is available 48-96 hours after online publication and is updated daily on week days.
Initial download of the metrics may take a while.