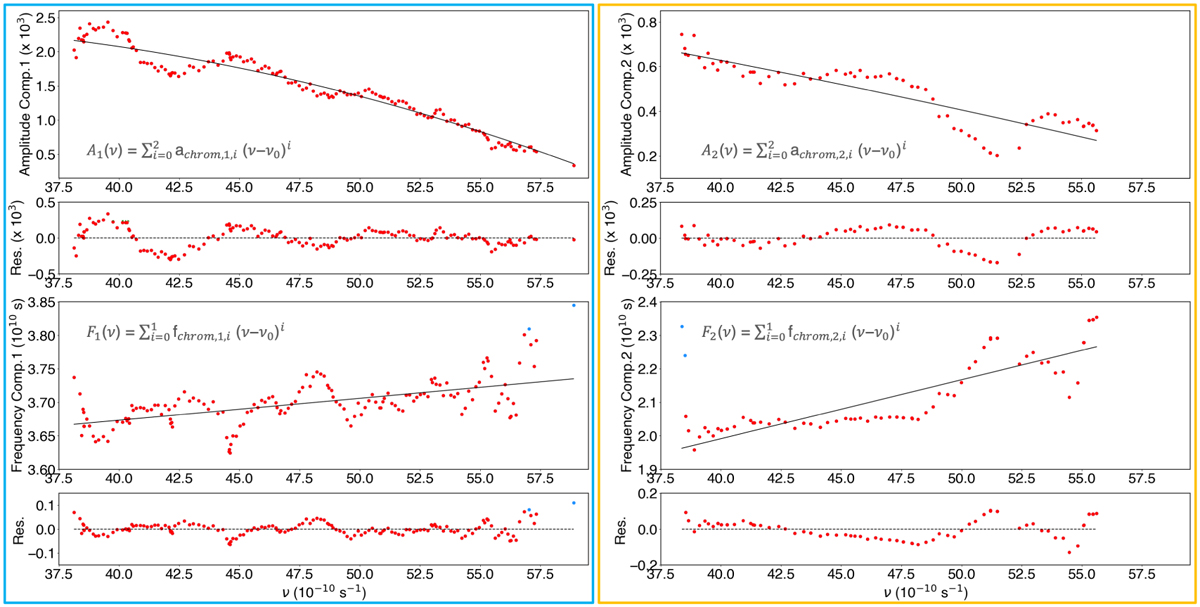
Fig. C.3
Download original image
Chromatic analysis. Red points in the top subpanels show measurements from the sampling step in Fig. C.2, for the amplitude (top panels) and frequency (bottom panels) of the first (blue box) and second (orange box) wiggle components. Bottom subpanels show residuals between the measurements and their best-fit model (solid black curves). Blue points are outliers automatically excluded from the fit through sigma-clipping. The wave-like variations in the measurements are an artifact of the sampling method.
Current usage metrics show cumulative count of Article Views (full-text article views including HTML views, PDF and ePub downloads, according to the available data) and Abstracts Views on Vision4Press platform.
Data correspond to usage on the plateform after 2015. The current usage metrics is available 48-96 hours after online publication and is updated daily on week days.
Initial download of the metrics may take a while.