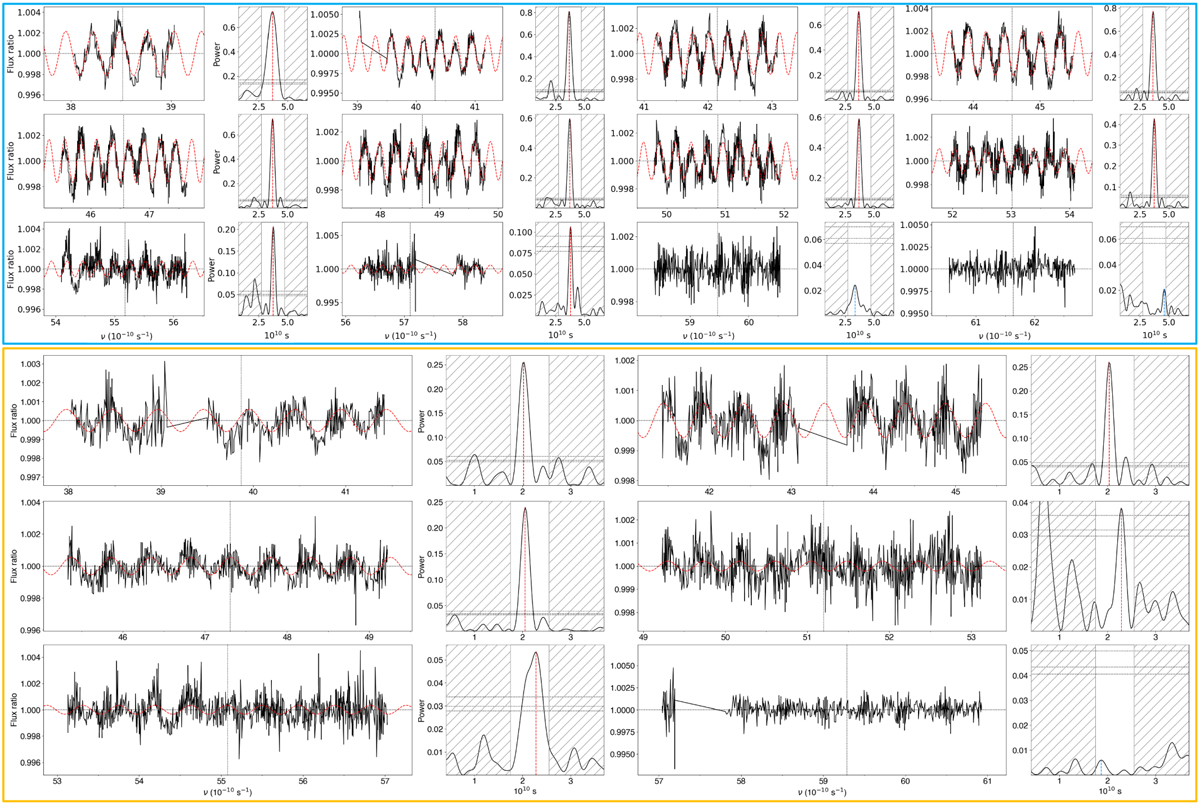
Fig. C.2
Download original image
Chromatic sampling, illustrated with exposure at index 14 in HD 209458b epoch 2. Subpanels show the processed transmission spectrum for consecutive positions of the sampling window, with the periodogram used to determine the local frequency Ak(vwindow) of the considered wiggle component (the unhatched range is set by the user to limit the search around the frequency expected from the screening step). The red model shows the sine model fitted at this frequency. The blue and orange boxes respectively show the sampling of the first and second wiggle components, whose frequencies are distinct enough that they can be processed successively. The width of the sliding window is adjusted to cover several cycles of the considered wiggle component while remaining small enough that its frequency is constant over the band.
Current usage metrics show cumulative count of Article Views (full-text article views including HTML views, PDF and ePub downloads, according to the available data) and Abstracts Views on Vision4Press platform.
Data correspond to usage on the plateform after 2015. The current usage metrics is available 48-96 hours after online publication and is updated daily on week days.
Initial download of the metrics may take a while.