Fig. 2
Download original image
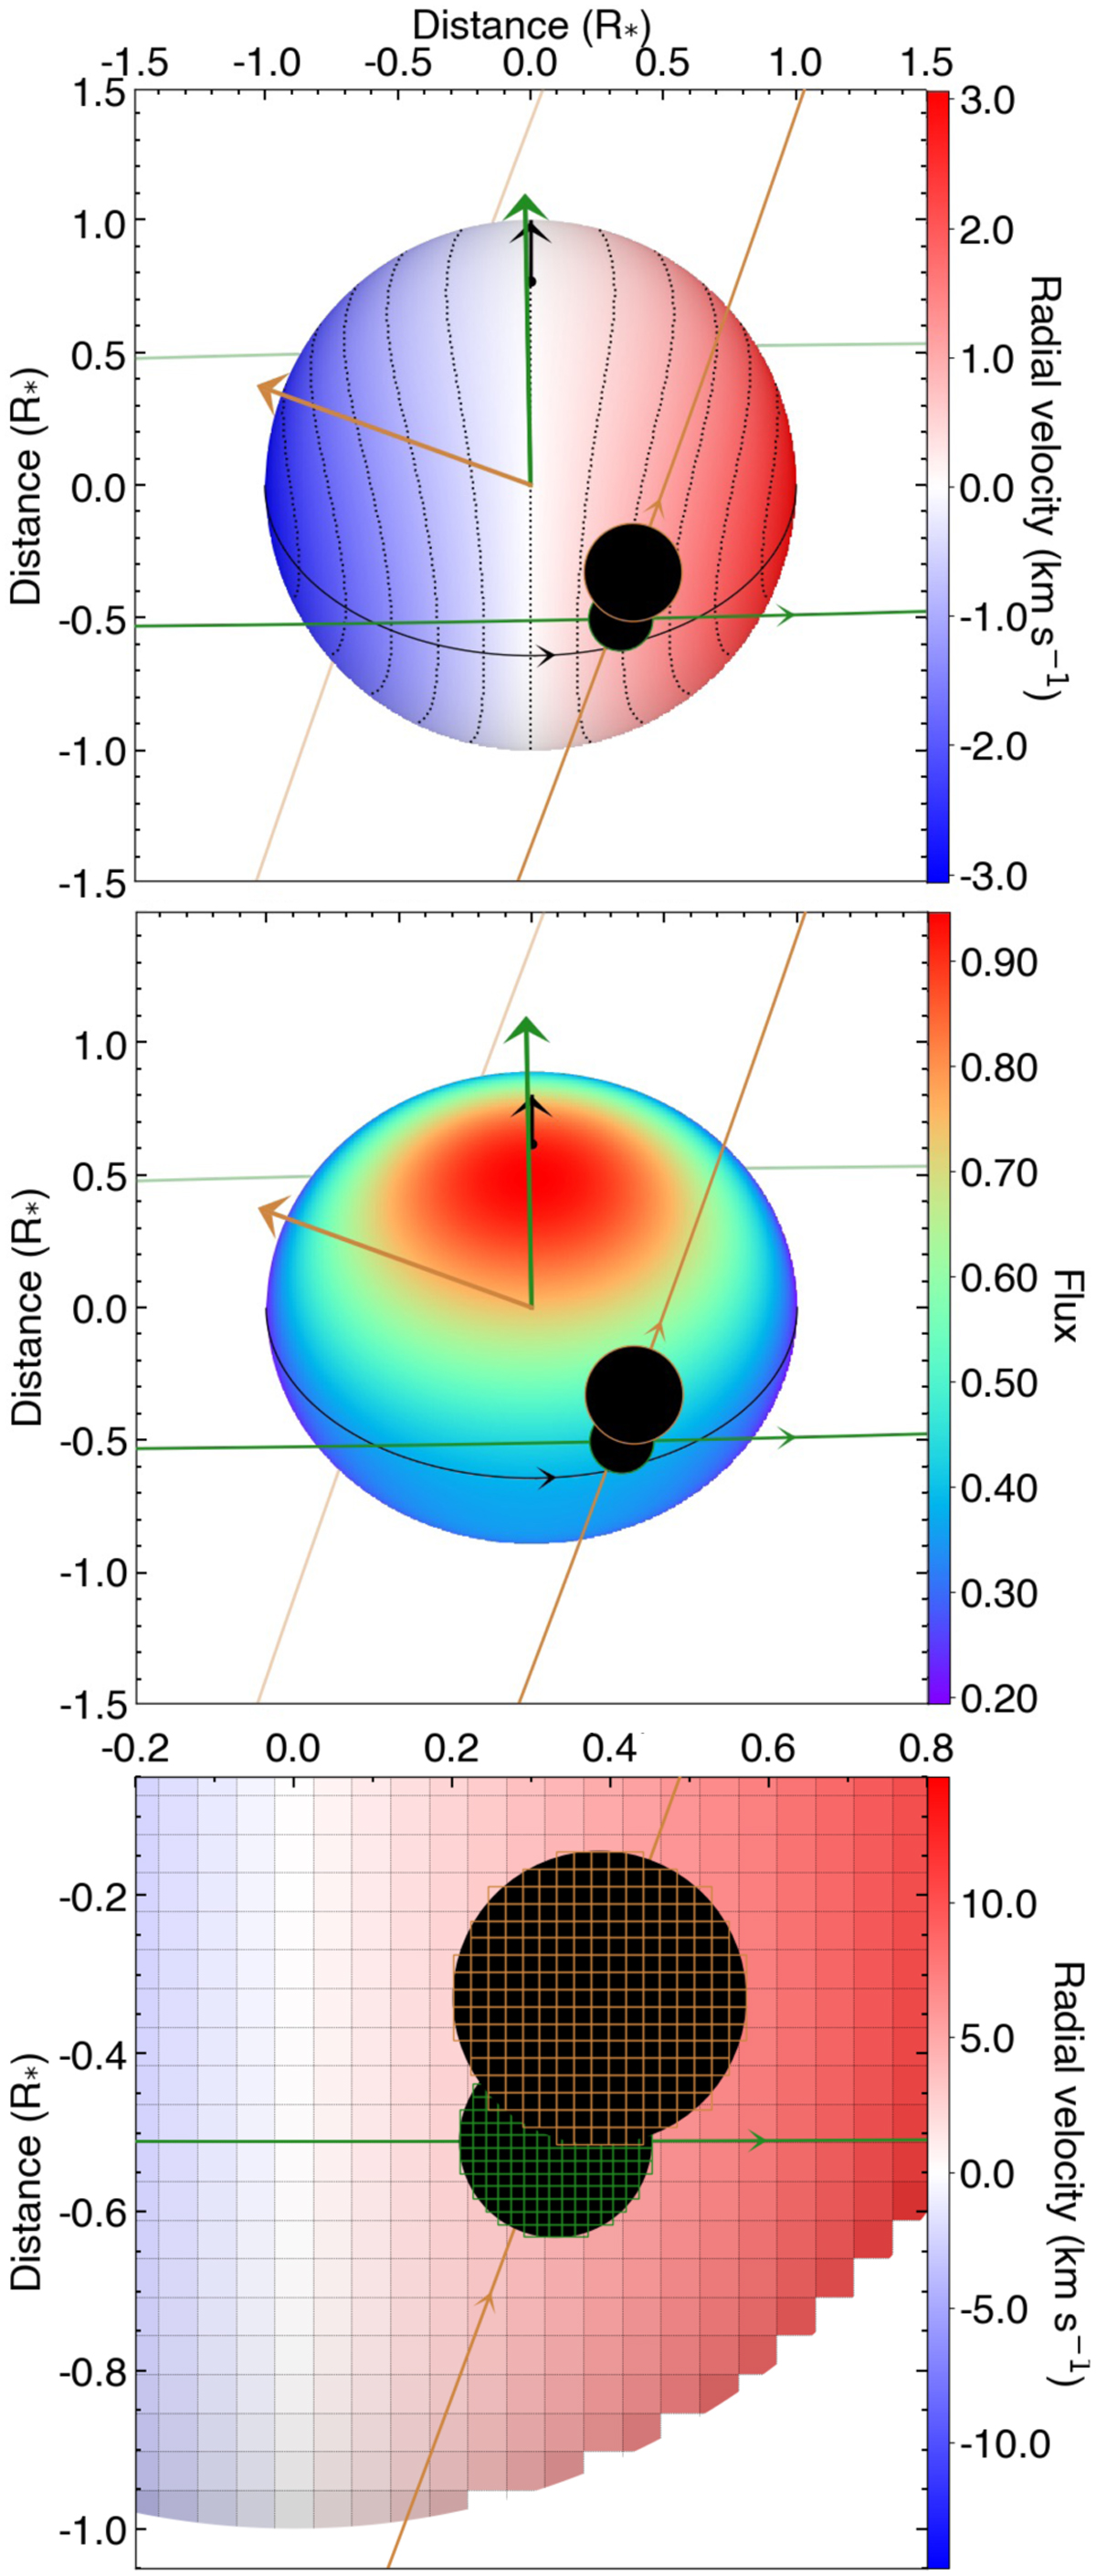
Views of ANTARESS sky-projected stellar grid for an imaginary system in various configurations highlighting the workflow possibilities. The plots X and Y axis correspond to x*sky and y*sky (see text). The stellar equator is shown as a solid black line, and the projected stellar spin axis as a black arrow extending from the north pole. Two planets (black disks) move along their orbital trajectory, whose 3D orientation is indicated by the normal to the orbital plane (green and golden arrows). Top: star shown rotating differentially between equator and poles and is colored as a function of its photospheric rv field (dotted black lines show iso-rv curves). Middle: star is fast-rotating and oblate, colored as a function of its intensity field (darkened at the limbs and brightened at the poles by gravity-darkening). Bottom: zoom-in on the planet-planet occultation. The grids discretizing the star and planets are displayed with a low resolution for clarity purpose.
Current usage metrics show cumulative count of Article Views (full-text article views including HTML views, PDF and ePub downloads, according to the available data) and Abstracts Views on Vision4Press platform.
Data correspond to usage on the plateform after 2015. The current usage metrics is available 48-96 hours after online publication and is updated daily on week days.
Initial download of the metrics may take a while.