Fig. 18
Download original image
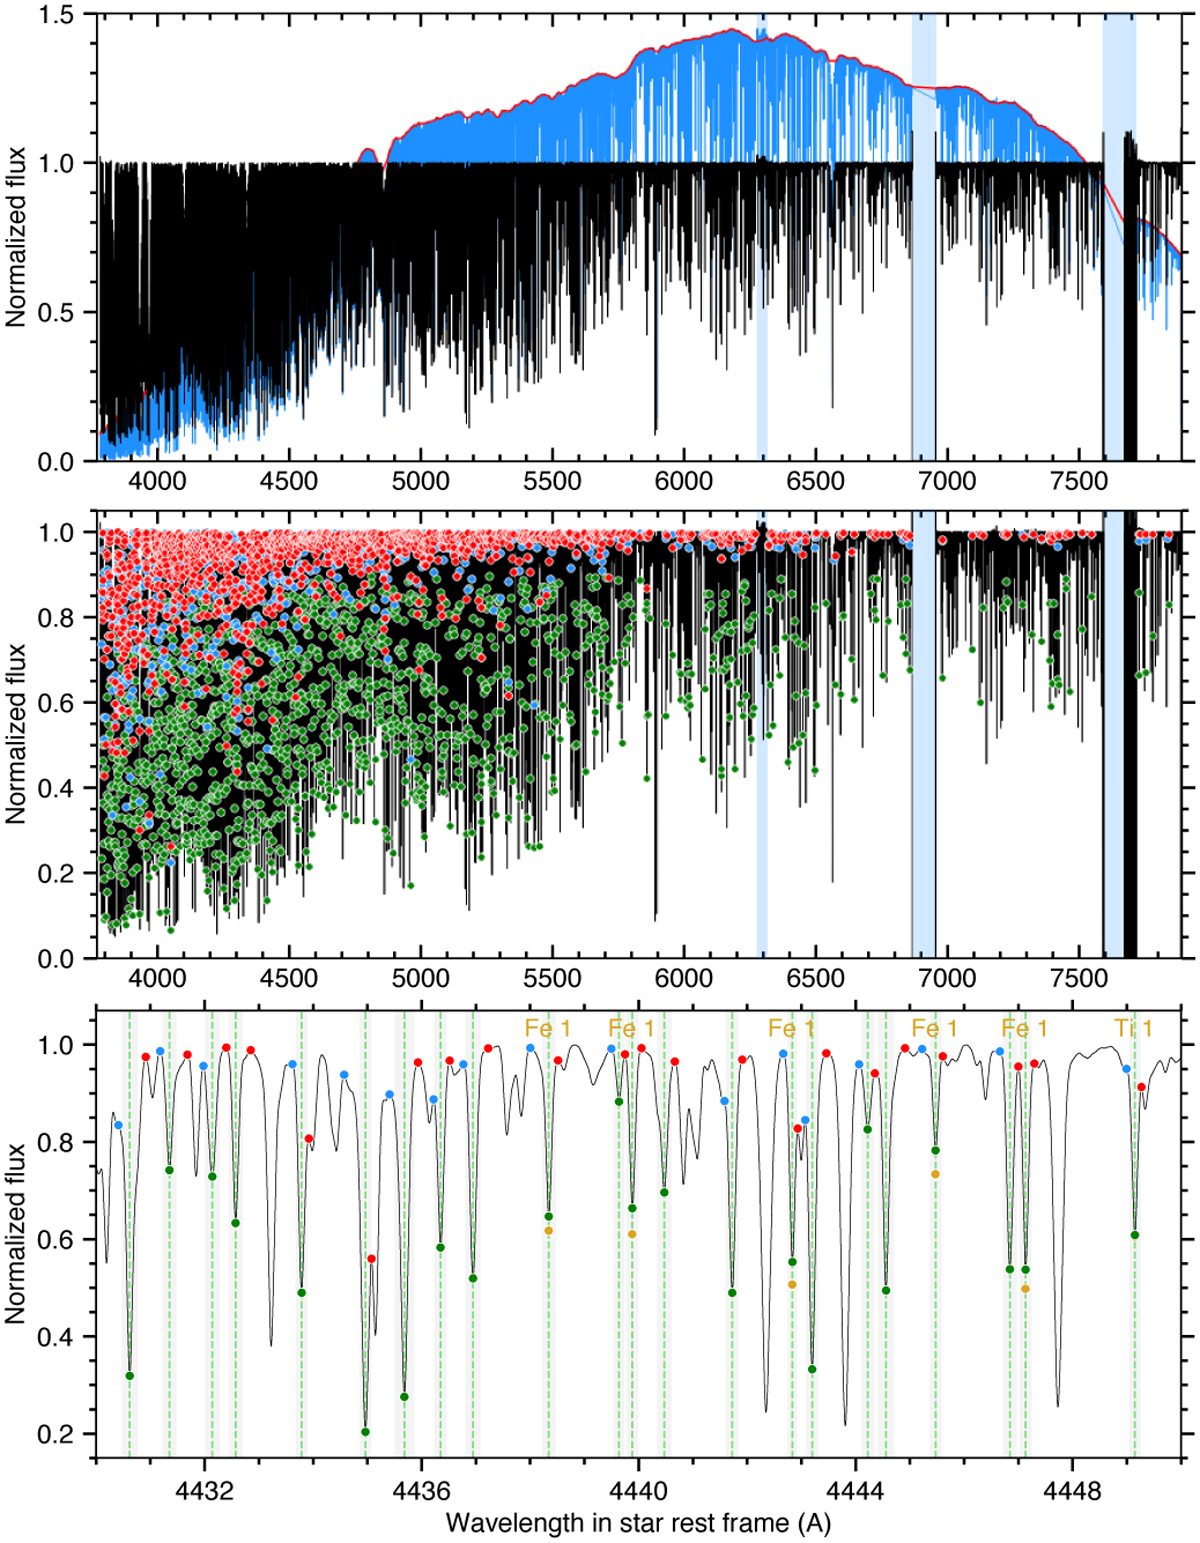
Generation of a CCF mask for HD 209458. Top panel: Master disk-integrated spectrum over all out-of-transit 1D spectra, before (blue) and after (black) normalization with the stellar continuum (red). Shaded blue areas are excluded due to strong telluric contamination. Middle panel: final mask lines, identified in the master spectrum by their minimum (green disks) and surrounding maxima (red disks). Bottom panel: zoom highlighting the range of each mask line (shaded bands) and, when cross-matched with VALD, their origin species.
Current usage metrics show cumulative count of Article Views (full-text article views including HTML views, PDF and ePub downloads, according to the available data) and Abstracts Views on Vision4Press platform.
Data correspond to usage on the plateform after 2015. The current usage metrics is available 48-96 hours after online publication and is updated daily on week days.
Initial download of the metrics may take a while.