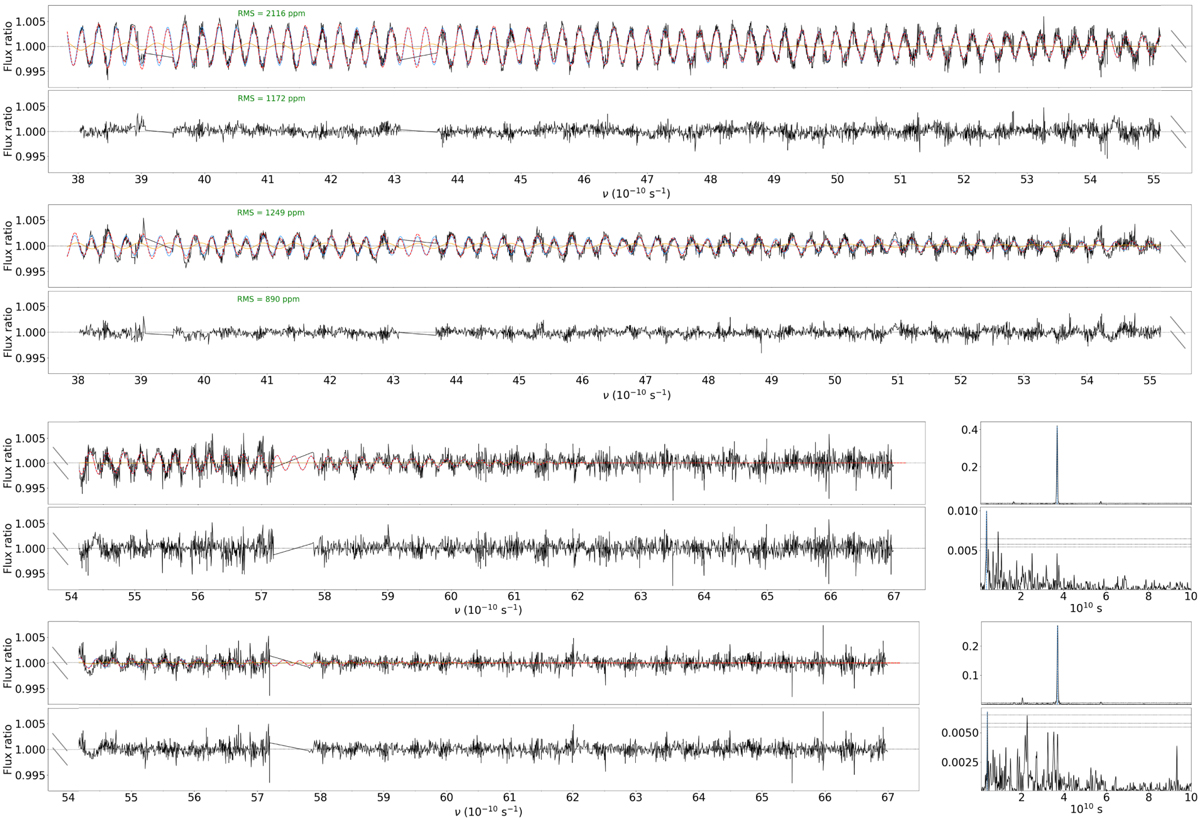
Fig. 11
Download original image
Transmission spectra of HD 209458 as a function of light frequency, highlighting different wiggle patterns at the start (exposure 14, top panel) and end (exposure 79, bottom panel) of epoch 2. Top (resp. bottom) subpanels show data before (resp. after) wiggle correction. The wiggle model, overplotted as a dashed red line, is a beat pattern between a dominant (blue) and weaker (orange) component. Right panels show periodograms of the data (horizontal dashed lines are false-alarm probability levels at 1, 5, and 10%), highlighting the removal of these components.
Current usage metrics show cumulative count of Article Views (full-text article views including HTML views, PDF and ePub downloads, according to the available data) and Abstracts Views on Vision4Press platform.
Data correspond to usage on the plateform after 2015. The current usage metrics is available 48-96 hours after online publication and is updated daily on week days.
Initial download of the metrics may take a while.