Fig. 10
Download original image
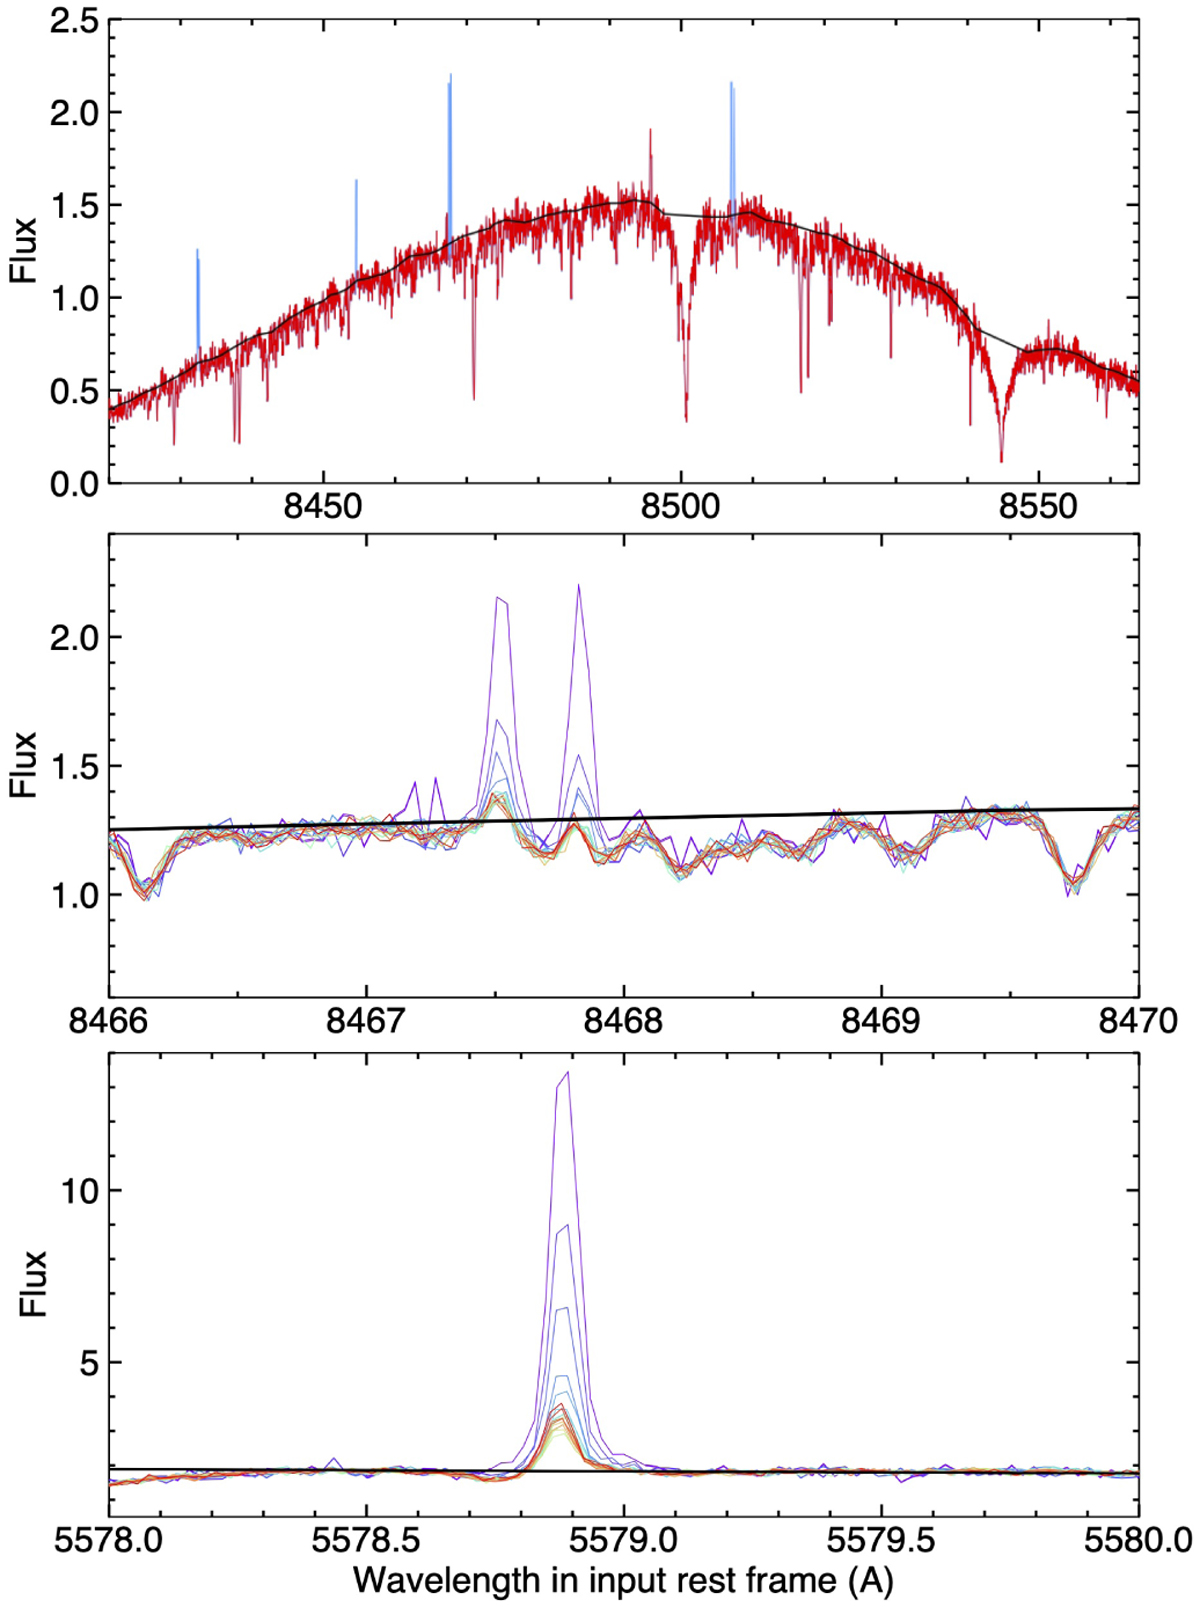
Persistent peaks masking of a CARMENES time series. Top panel: telluric emission lines (highlighted in blue in the first exposure spectrum, shown in red) were identified through comparison with the stellar continuum (black). Middle panel: zoom on the strongest telluric line from the top panel, plotted over the rainbow scale with increasing orbital phase. This specific line was flagged over the first ten exposures, after which the decreasing airmass makes it negligible. Bottom panel: zoom on one of the strongest telluric lines in the CARMENES range, masked over the entire epoch.
Current usage metrics show cumulative count of Article Views (full-text article views including HTML views, PDF and ePub downloads, according to the available data) and Abstracts Views on Vision4Press platform.
Data correspond to usage on the plateform after 2015. The current usage metrics is available 48-96 hours after online publication and is updated daily on week days.
Initial download of the metrics may take a while.