Open Access
Fig. A.2.
Download original image
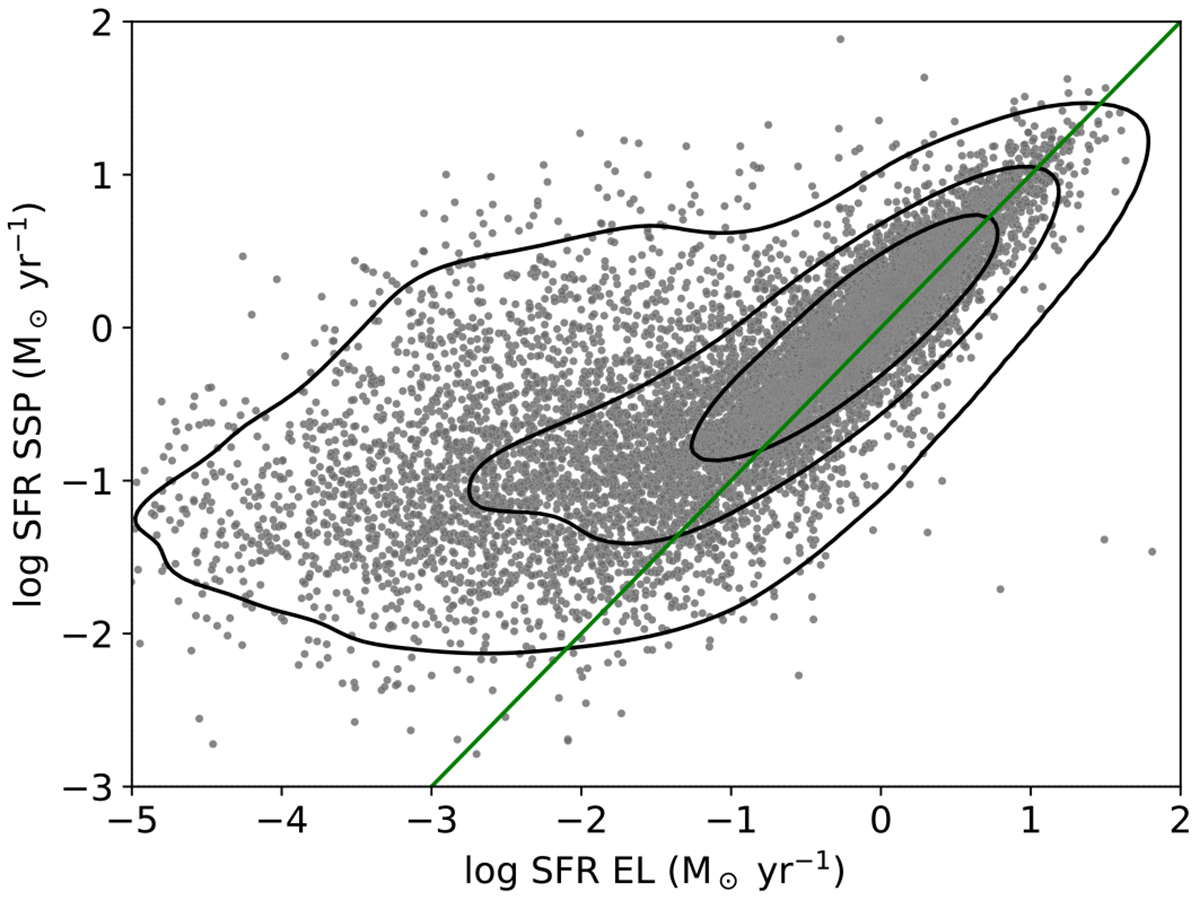
Comparison between the current SFR in our sample measured using the Hα emission line (X-axis) and full spectral fitting selecting the last 30 Myr (Y axis). The black contours show the general distribution and the green line the 1:1 relation.
Current usage metrics show cumulative count of Article Views (full-text article views including HTML views, PDF and ePub downloads, according to the available data) and Abstracts Views on Vision4Press platform.
Data correspond to usage on the plateform after 2015. The current usage metrics is available 48-96 hours after online publication and is updated daily on week days.
Initial download of the metrics may take a while.