Fig. 2.
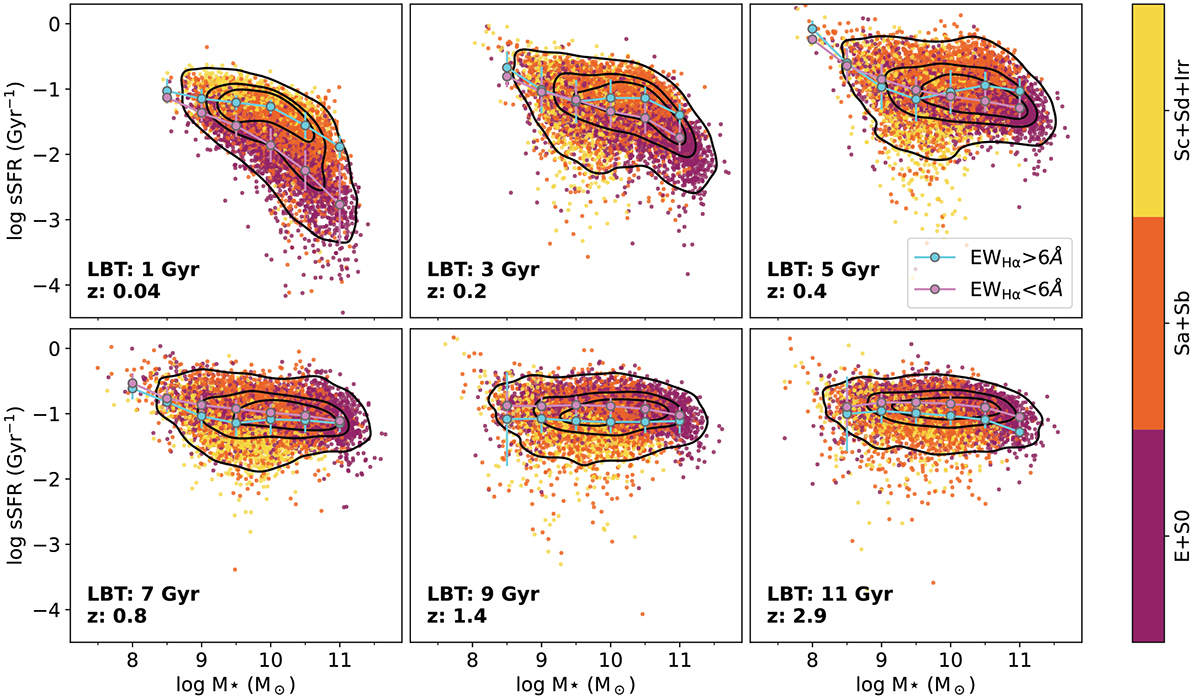
Download original image
Evolution of the sSFR over cosmic time for the galaxies in the MaNGA sample. In each panel the M* and sSFR of the galaxies measured at different LBT are shown. The colour of the data points corresponds to the currently observed morphology of the galaxies. The black contours enclose 95%, 65% and 35% of the sample, respectively. The cyan and violet dots and lines show the median sSFR within 0.5 dex wide M* bins, selecting galaxies above and below 6 Å in EWHα, respectively. The error bars for the dots show the 25th and 75th percentile of the distribution within each M* bin.
Current usage metrics show cumulative count of Article Views (full-text article views including HTML views, PDF and ePub downloads, according to the available data) and Abstracts Views on Vision4Press platform.
Data correspond to usage on the plateform after 2015. The current usage metrics is available 48-96 hours after online publication and is updated daily on week days.
Initial download of the metrics may take a while.