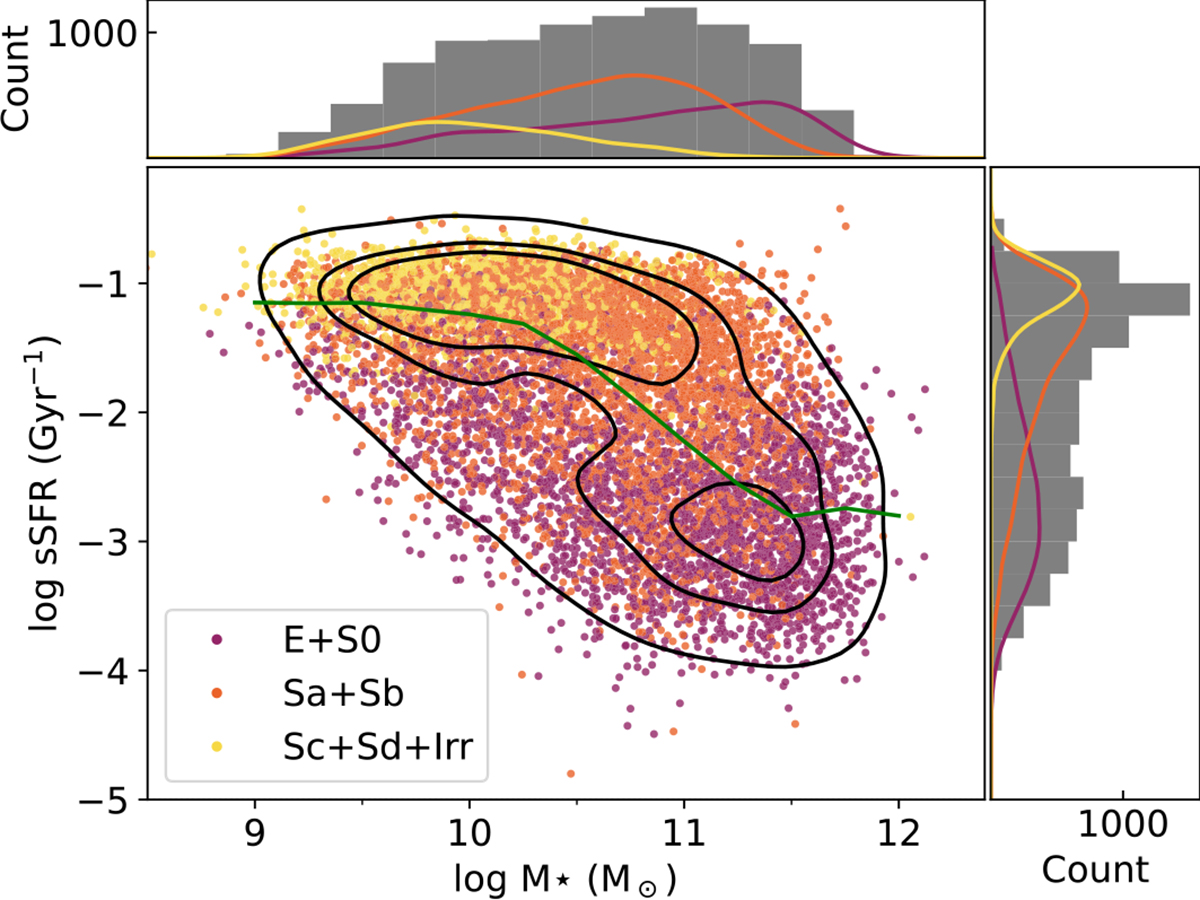
Fig. 1.
Download original image
Currently observed sSFR of MaNGA galaxies compared to their M* (bottom left). The black contours enclose 95%, 65% and 35% of the sample respectively. The green line is the median sSFR within 0.25 dex wide M* bins. In the top and right panels, the distributions in M* and sSFR, respectively, are shown as histograms, with the three morphological bins shown in lines of the corresponding colour.
Current usage metrics show cumulative count of Article Views (full-text article views including HTML views, PDF and ePub downloads, according to the available data) and Abstracts Views on Vision4Press platform.
Data correspond to usage on the plateform after 2015. The current usage metrics is available 48-96 hours after online publication and is updated daily on week days.
Initial download of the metrics may take a while.