Fig. 3.
Download original image
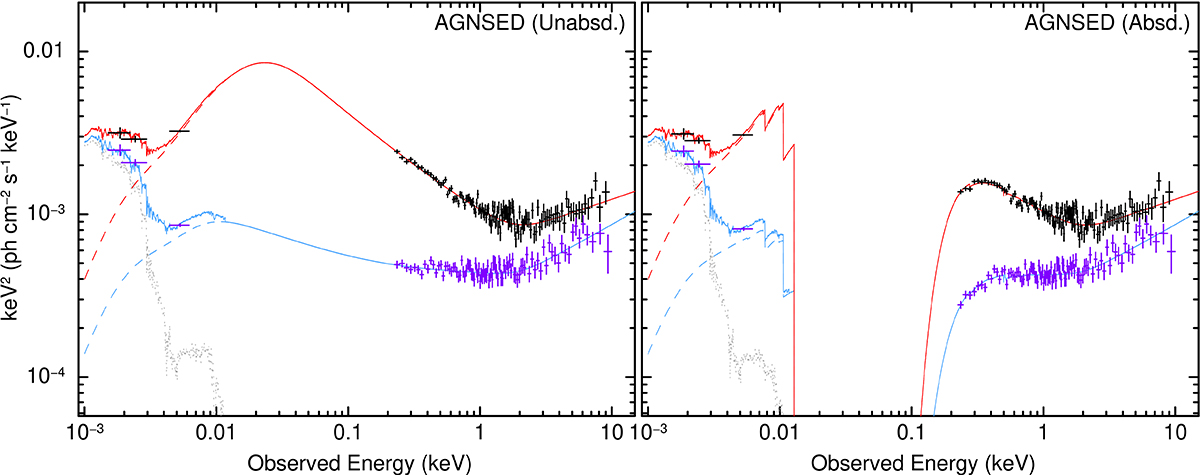
Flare peak and post-flare SEDs and the best-fitting AGNSED model. In the right panel, we present the (observed and absorbed/reddened) data and the best-fitting models. In the left column, we have corrected both data and models for Galactic absorption and reddening. In both panels, black and purple data points denote, respectively, flaring and post-flaring state data. XMM-Newton pn data have been rebinned by a factor of 4 for plotting purposes only. In both panels, red and blue lines denote, respectively, the best-fitting models to the flaring and post-flaring states. The dashed lines denote the best-fitting AGNSED components, the grey dashed line represents the host galaxy template, and the solid lines represent the total models.
Current usage metrics show cumulative count of Article Views (full-text article views including HTML views, PDF and ePub downloads, according to the available data) and Abstracts Views on Vision4Press platform.
Data correspond to usage on the plateform after 2015. The current usage metrics is available 48-96 hours after online publication and is updated daily on week days.
Initial download of the metrics may take a while.