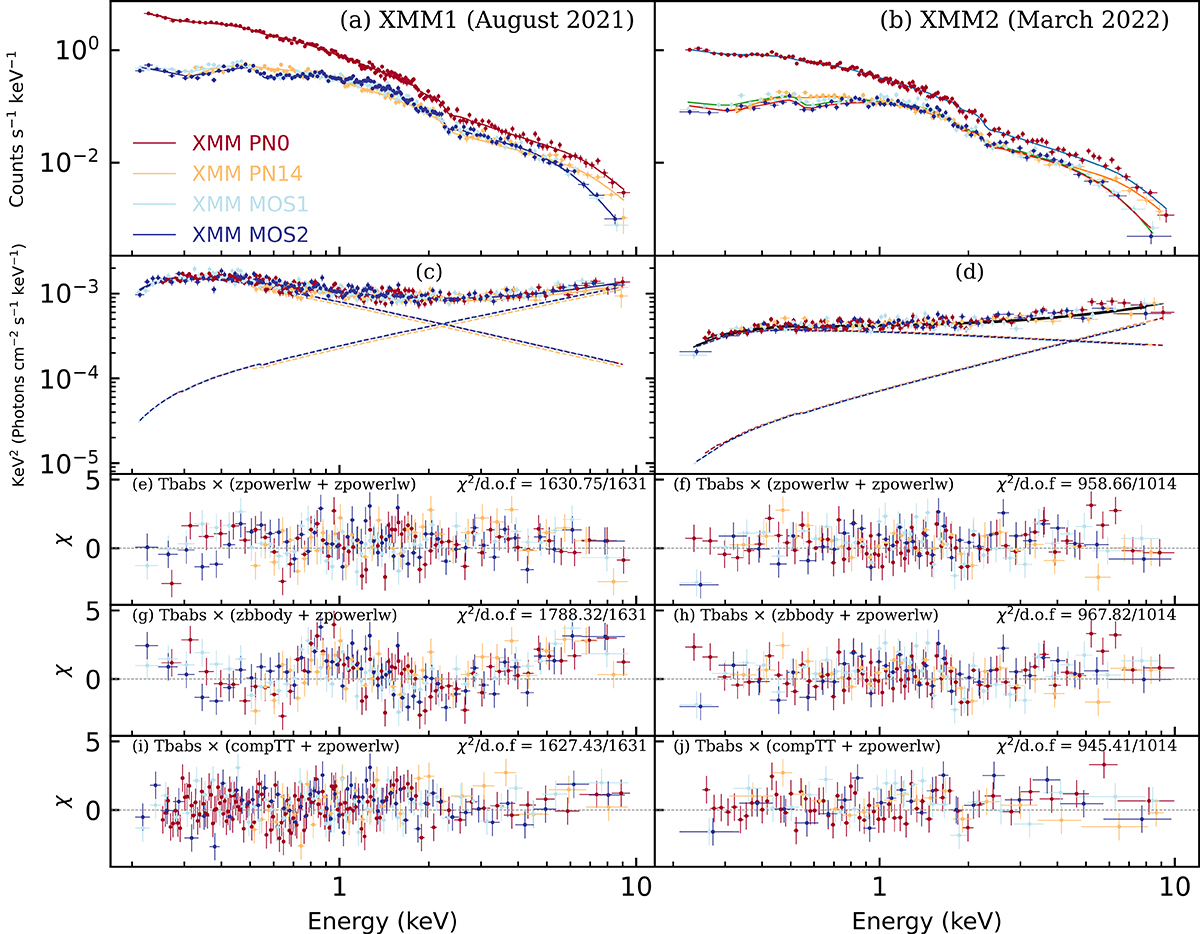
Fig. 2.
Download original image
XMM-Newton EPIC spectra and best-fitting models. The left column shows the data and models for the XMM1 observation in August 2021, taken during the flaring of the event. The right column shows the data and models for the XMM2 observation, taken six months later as the flare subsided. Panels a and b show the counts spectra, with the best-fitting double power-law model plotted as a solid line. Panels c and d show the “unfolded” best-fitting double power-law models and data; the individual power-law components are plotted with dashed lines, and the summed model is shown as a solid line. Panels e and f show the residuals to double power-law model fits, which are our best-fitting phenomenological models. Panels g and h show the results from fitting a blackbody component to the soft band plus a hard X-ray power law. Panels i and j show the results from fitting a Comptonization model (compTT) to the soft band plus a hard X-ray power law.
Current usage metrics show cumulative count of Article Views (full-text article views including HTML views, PDF and ePub downloads, according to the available data) and Abstracts Views on Vision4Press platform.
Data correspond to usage on the plateform after 2015. The current usage metrics is available 48-96 hours after online publication and is updated daily on week days.
Initial download of the metrics may take a while.