Fig. 1.
Download original image
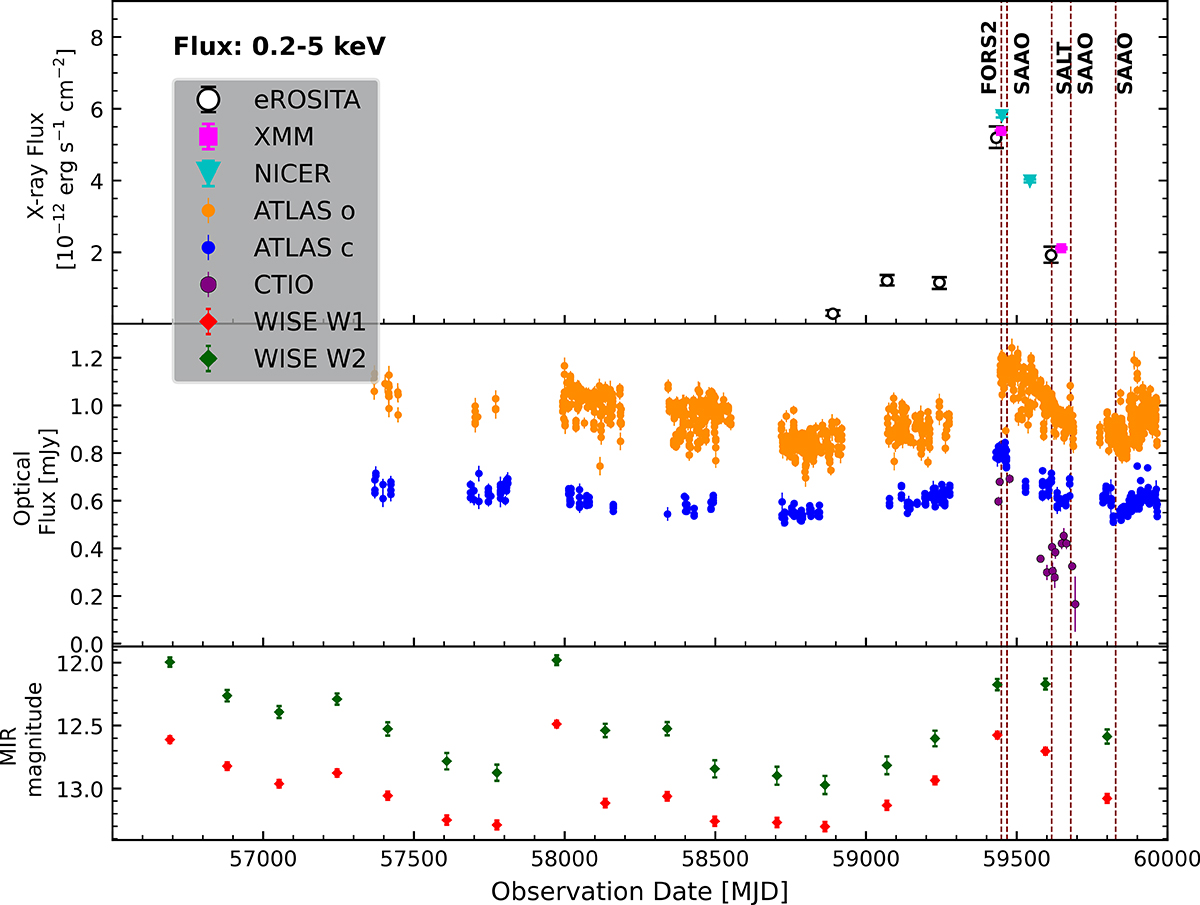
Multiwavelength light curves of J0408−38. In the top panel, we plot the 0.2–5 keV X-ray flux from the XMM-Newton observations, the five eRASS scans, and the two NICER observations. In the middle panel, we plot the optical light curves from the ATLAS photometric monitoring, showing data taken in the cyan (c, covering 420–650 nm) and orange (o, 560–820 nm) filters, as well as data from our B-band photometric monitoring at CTIO, shown in purple. In the bottom panel, we plot the MIR light curve from WISE’s W1 and W2 bands. The source was flaring around the same time in multiple wavelengths. The epochs of optical spectroscopy are denoted by red vertical dotted lines.
Current usage metrics show cumulative count of Article Views (full-text article views including HTML views, PDF and ePub downloads, according to the available data) and Abstracts Views on Vision4Press platform.
Data correspond to usage on the plateform after 2015. The current usage metrics is available 48-96 hours after online publication and is updated daily on week days.
Initial download of the metrics may take a while.