Fig. 1
Download original image
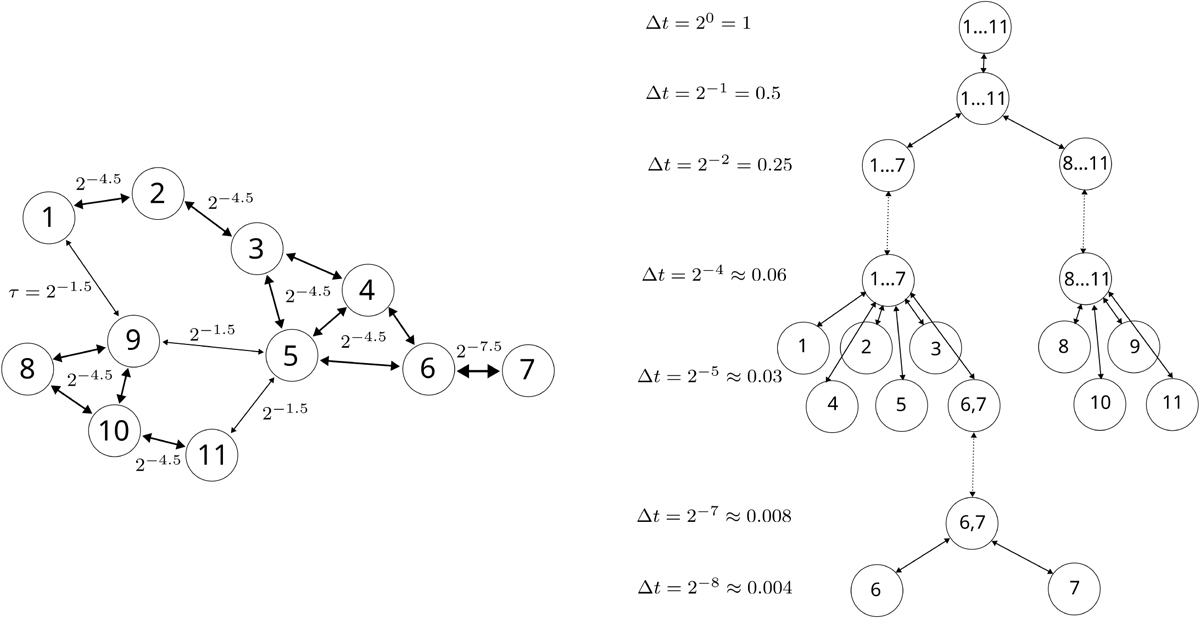
Timescale matrix for a VENICE implementation. Left: representation of the coupling timescale matrix, τ, of an operator set as an undirected, weighted graph. Edges are labelled with the coupling timescale; some edges between triangulated nodes share labels for clarity. The coupling timescale between unconnected nodes is ∞. Right: tree representation of the recursive splitting of connected components, for the system on the left. Dotted lines denote skipped layers of nodes with a single parent and child node.
Current usage metrics show cumulative count of Article Views (full-text article views including HTML views, PDF and ePub downloads, according to the available data) and Abstracts Views on Vision4Press platform.
Data correspond to usage on the plateform after 2015. The current usage metrics is available 48-96 hours after online publication and is updated daily on week days.
Initial download of the metrics may take a while.