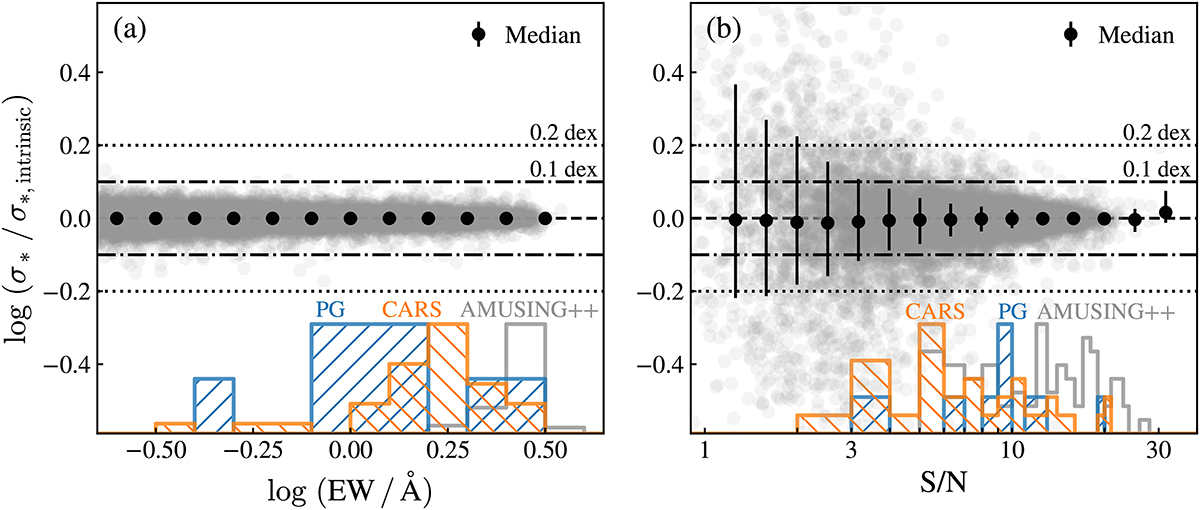
Fig. 6.
Download original image
Systematic uncertainty for the stellar velocity dispersion as a function of the (a) EW and (b) S/N of Ca IIλ8542. The dashed line represents the equality between the observed σ* and the value obtained after degrading the spectra quality; dot-dashed and dotted lines represent the 0.1 and 0.2 dex scatter, respectively. At the bottom of each panel, the normalized histograms show the distribution of EW or S/N values obtained for the PG quasars, CARS AGNs, and the inactive galaxy subsample taken from the AMUSING++ survey.
Current usage metrics show cumulative count of Article Views (full-text article views including HTML views, PDF and ePub downloads, according to the available data) and Abstracts Views on Vision4Press platform.
Data correspond to usage on the plateform after 2015. The current usage metrics is available 48-96 hours after online publication and is updated daily on week days.
Initial download of the metrics may take a while.