Open Access
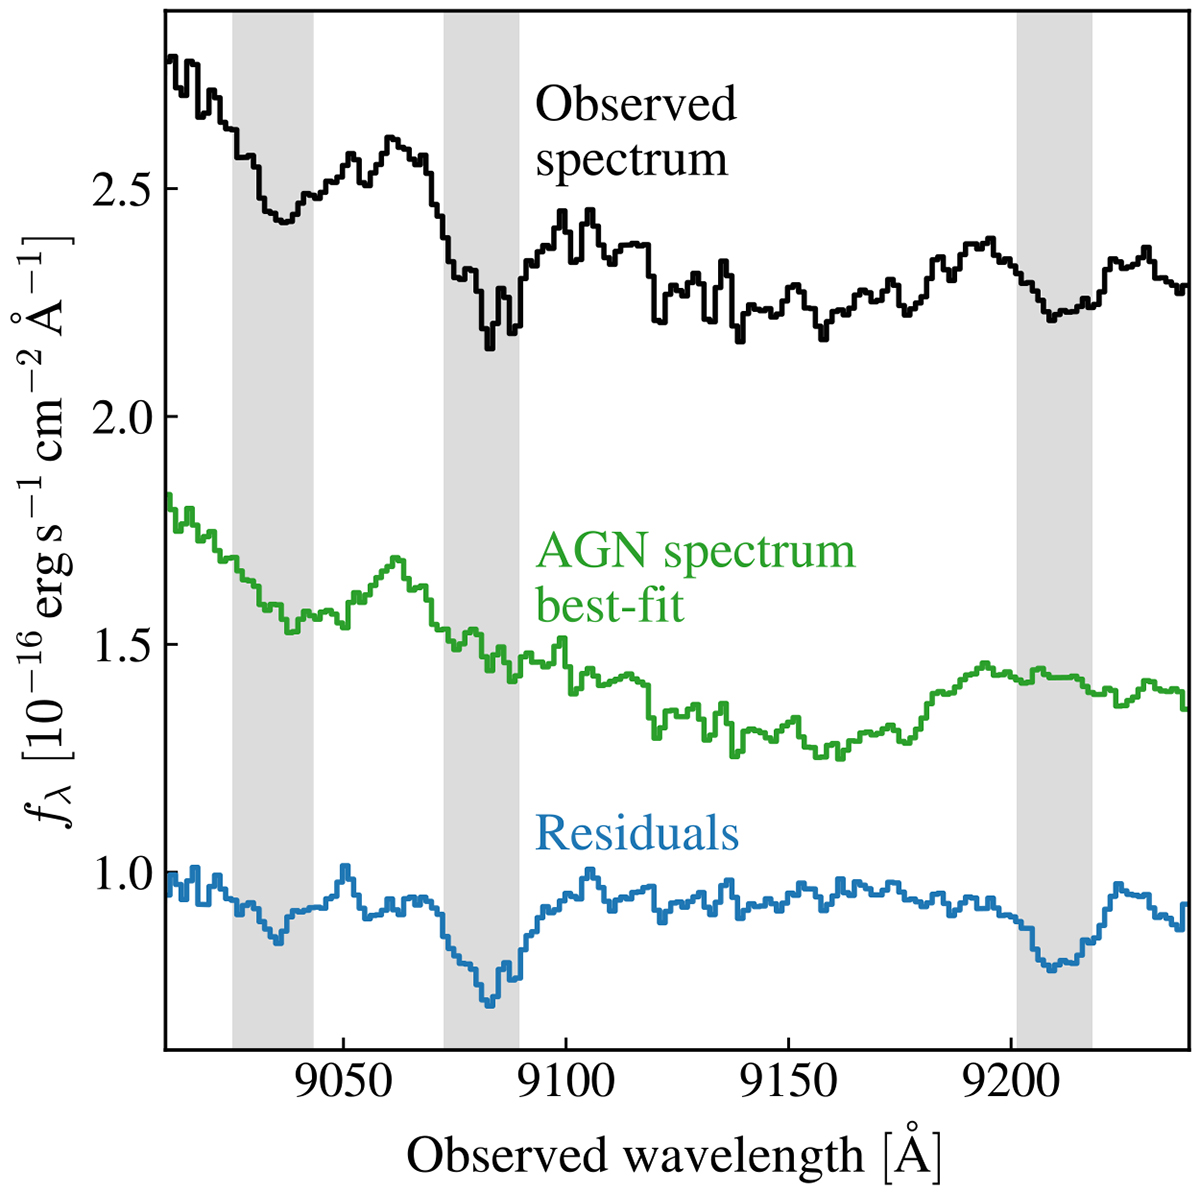
Fig. 4.
Download original image
Example of the AGN emission subtraction procedure. The shaded regions highlight the masked spectral windows encompassing the CaT. The AGN template has been vertically shifted to improve figure visualization. The residuals correspond to the observed spectrum minus AGN template.
Current usage metrics show cumulative count of Article Views (full-text article views including HTML views, PDF and ePub downloads, according to the available data) and Abstracts Views on Vision4Press platform.
Data correspond to usage on the plateform after 2015. The current usage metrics is available 48-96 hours after online publication and is updated daily on week days.
Initial download of the metrics may take a while.