Fig. C.1.
Download original image
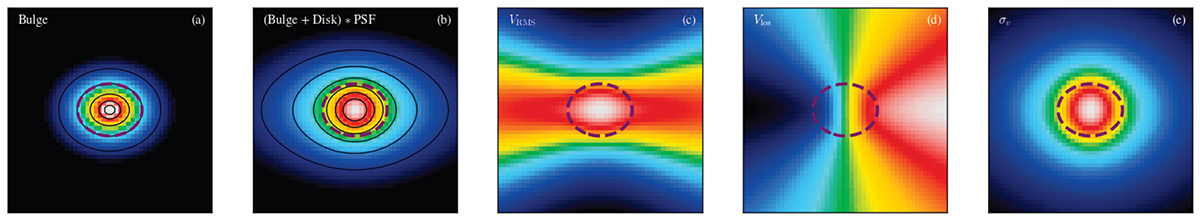
Example of a galaxy model analyzed in our test. (a) Intrinsic surface brightness distribution of the bulge. (b) Galaxy bulge plus disk surface brightness distribution convolved by PSF. (b) “RMS” velocity ![]() map. (c) Line-of-sight velocity field. (d) Velocity dispersion map. In all panels, the magenta dashed curve shows the bulge half-light radius. We apply the color scale in panels (a) and (b). The galaxy kinematics obtained from JAMPY (Cappellari 2008).
map. (c) Line-of-sight velocity field. (d) Velocity dispersion map. In all panels, the magenta dashed curve shows the bulge half-light radius. We apply the color scale in panels (a) and (b). The galaxy kinematics obtained from JAMPY (Cappellari 2008).
Current usage metrics show cumulative count of Article Views (full-text article views including HTML views, PDF and ePub downloads, according to the available data) and Abstracts Views on Vision4Press platform.
Data correspond to usage on the plateform after 2015. The current usage metrics is available 48-96 hours after online publication and is updated daily on week days.
Initial download of the metrics may take a while.