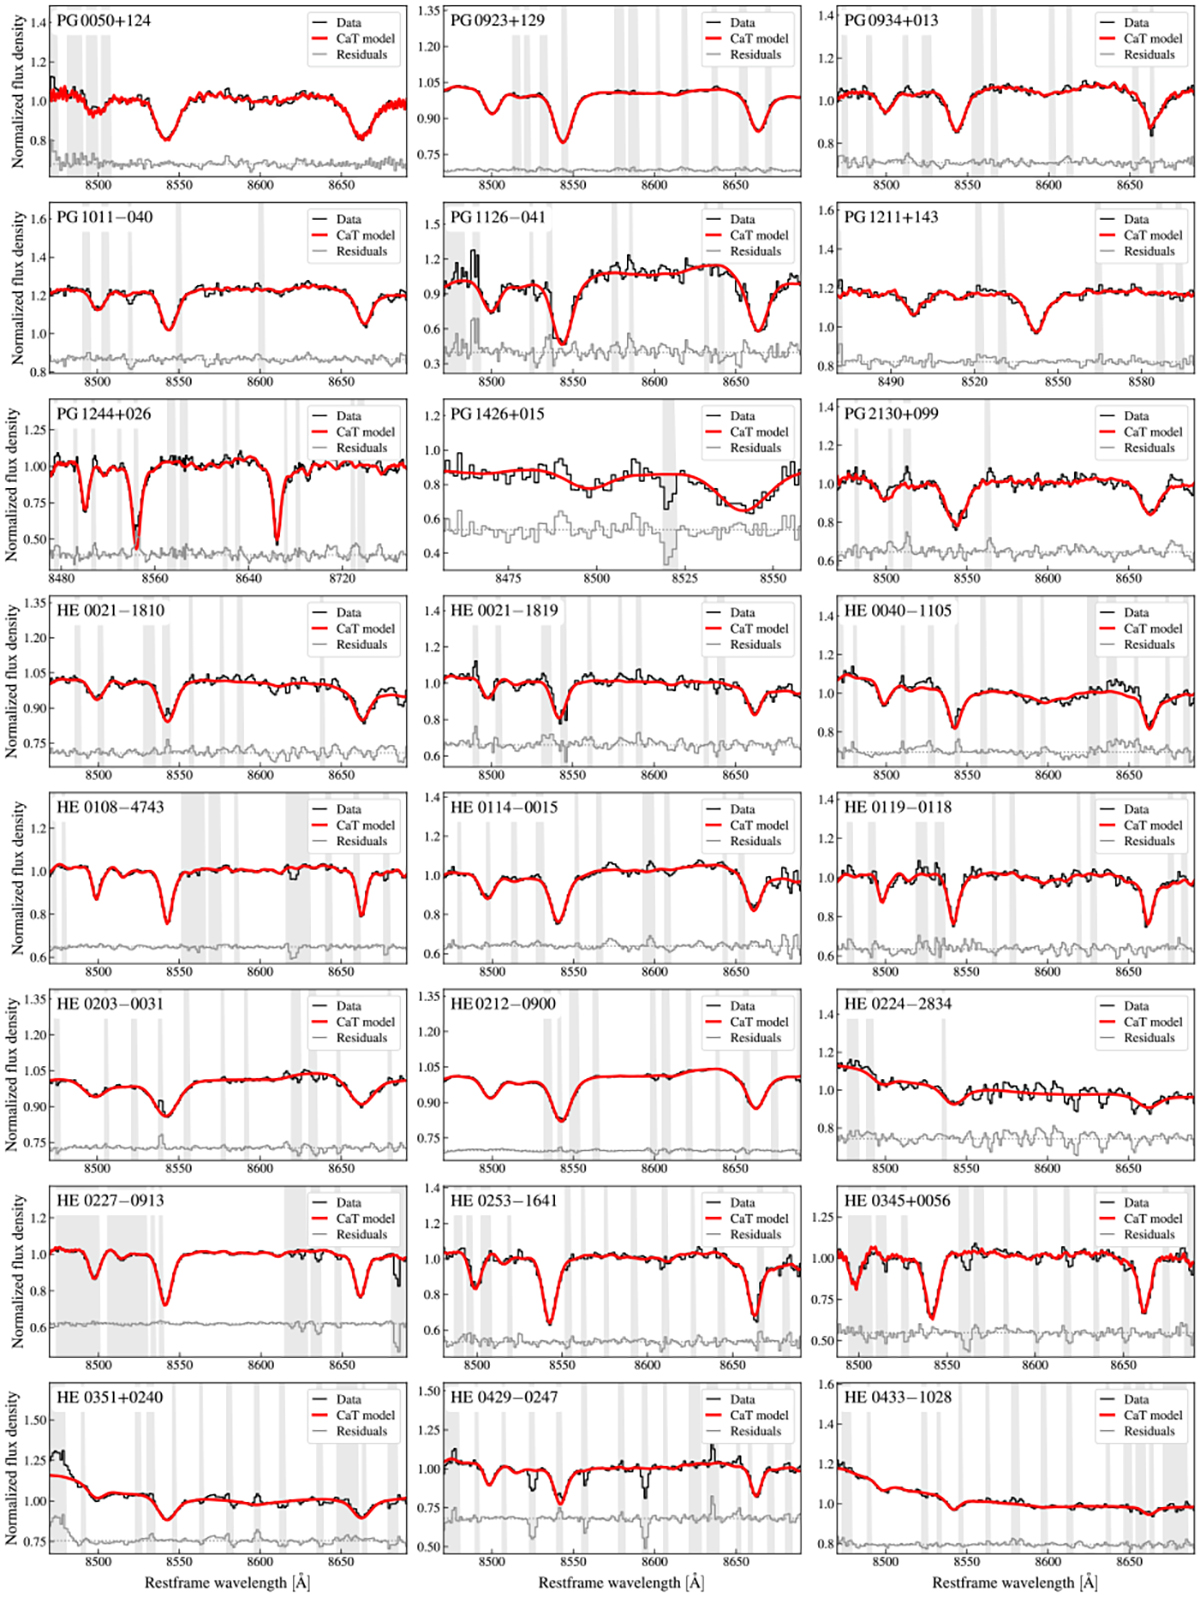
Fig. A.1.
Download original image
Extracted spectrum at the CaT wavelength range for each host galaxy. For clarity, the model residuals have been shifted to the flux density level indicated by the dotted line. The gray shaded regions represent the spectral windows that are masked to avoid prominent sky-line features detected in the corresponding variance spectra.
Current usage metrics show cumulative count of Article Views (full-text article views including HTML views, PDF and ePub downloads, according to the available data) and Abstracts Views on Vision4Press platform.
Data correspond to usage on the plateform after 2015. The current usage metrics is available 48-96 hours after online publication and is updated daily on week days.
Initial download of the metrics may take a while.