Open Access
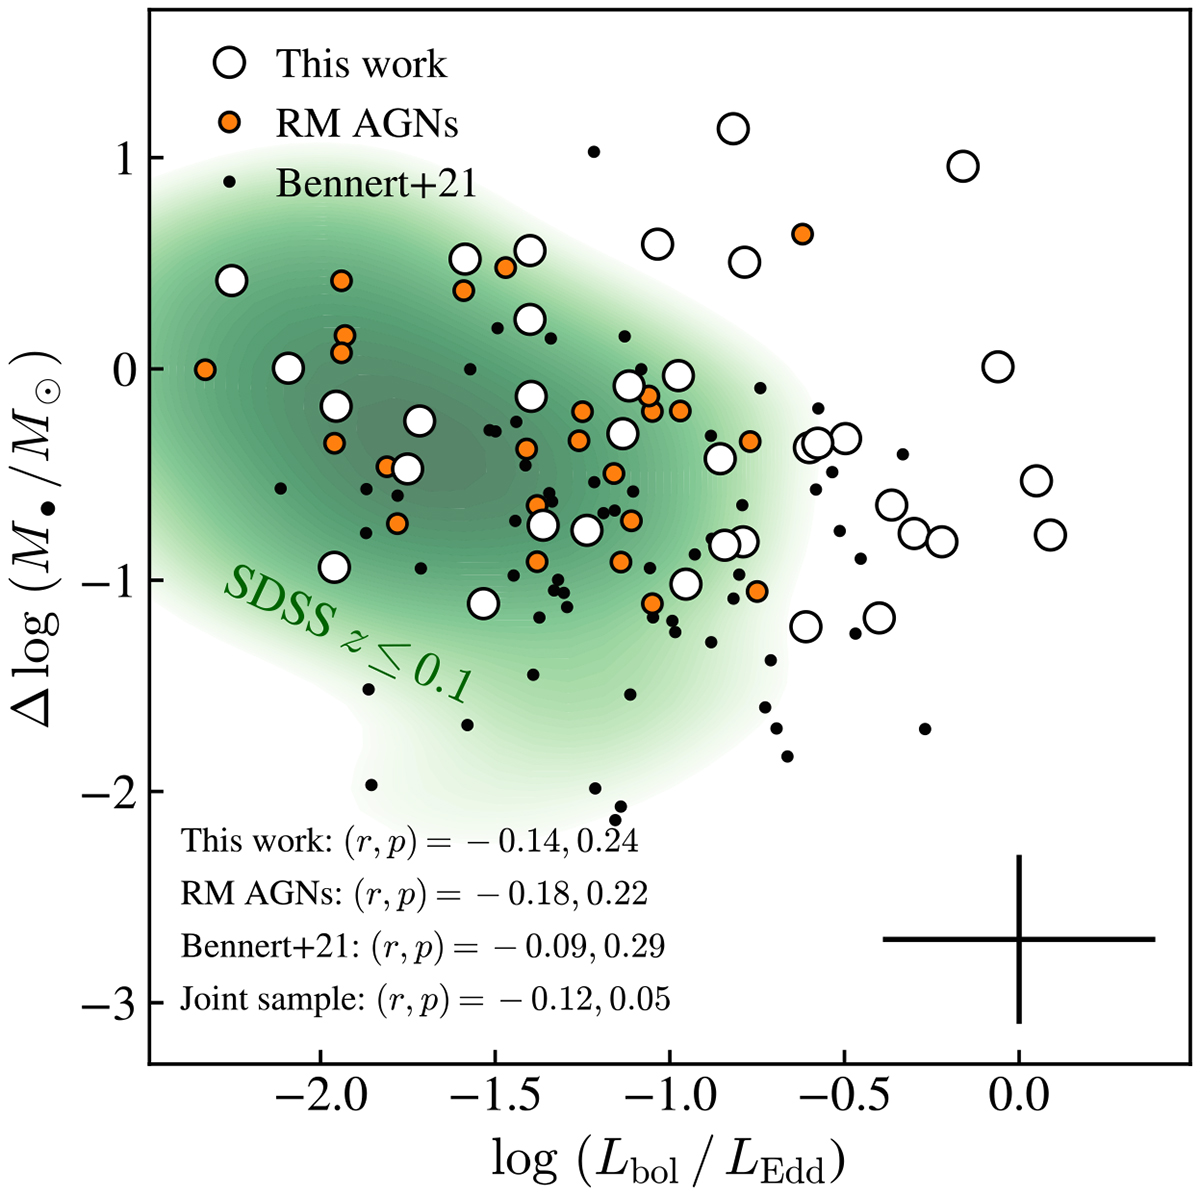
Fig. 14.
Download original image
Similar to Figure 12, but we add the RM AGNs presented in Ho & Kim (2014, 2015), the local AGN sample of Bennert et al. (2021), and the SDSS z ≤ 0.1 type 1 AGNs provided by Shen et al. (2008).
Current usage metrics show cumulative count of Article Views (full-text article views including HTML views, PDF and ePub downloads, according to the available data) and Abstracts Views on Vision4Press platform.
Data correspond to usage on the plateform after 2015. The current usage metrics is available 48-96 hours after online publication and is updated daily on week days.
Initial download of the metrics may take a while.