Fig. 9.
Download original image
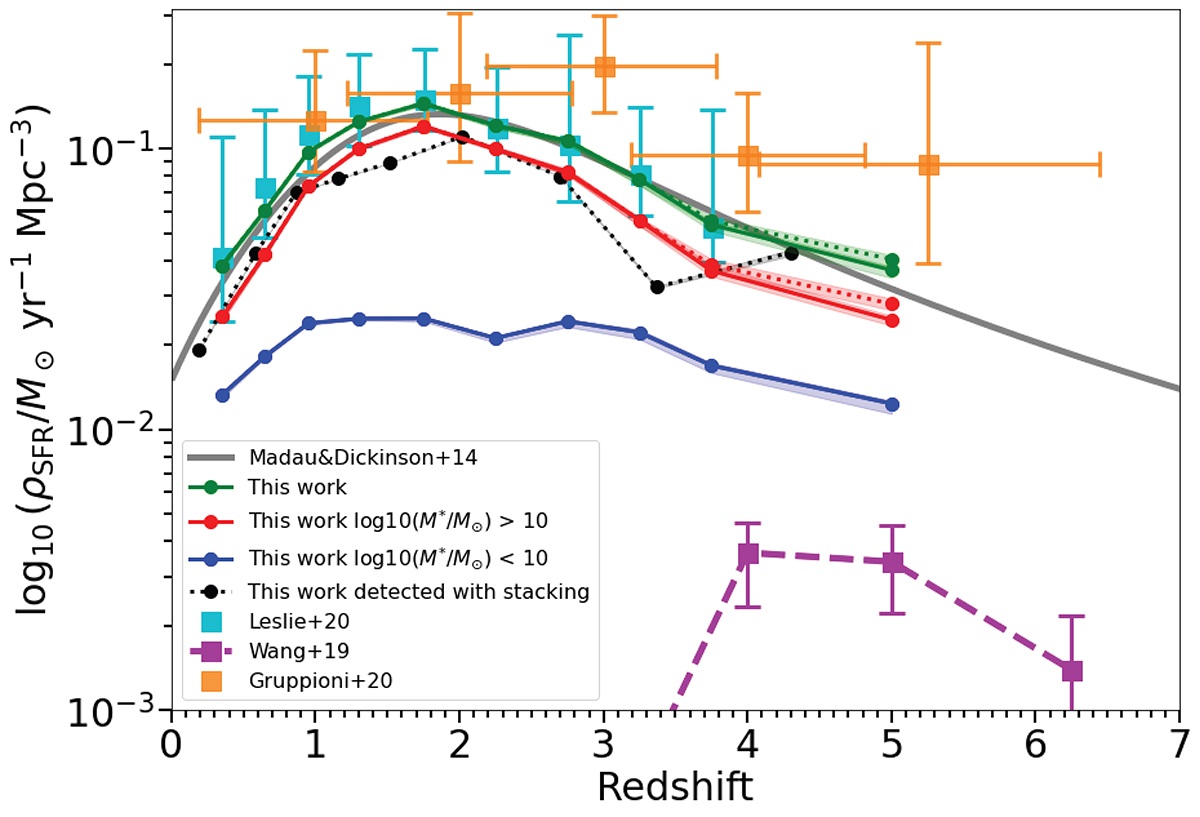
Cosmic star formation rate density (ρSFR) as a function of redshift. The green line represents the total ρSFR trend from this work (i.e. integrating the stellar mass function down to 3 × 10⁹ M⊙). The red and blue lines represent the contribution of galaxies with log10(M⋆/M⊙)> 10 and log10(M⋆/M⊙)< 10, respectively. The black dotted line represents the ρSFR detected with stacking. The purple squares show the contribution of H-dropout from Wang et al. (2019). The dotted green and red lines show the trend once H-dropout contribution from Wang et al. (2019) has been added to the respective coloured solid lines. The grey line represents the trend from Madau & Dickinson (2014). The cyan and orange squares represent ρSFR estimate from Leslie et al. (2020) and Gruppioni et al. (2020), respectively.
Current usage metrics show cumulative count of Article Views (full-text article views including HTML views, PDF and ePub downloads, according to the available data) and Abstracts Views on Vision4Press platform.
Data correspond to usage on the plateform after 2015. The current usage metrics is available 48-96 hours after online publication and is updated daily on week days.
Initial download of the metrics may take a while.