Open Access
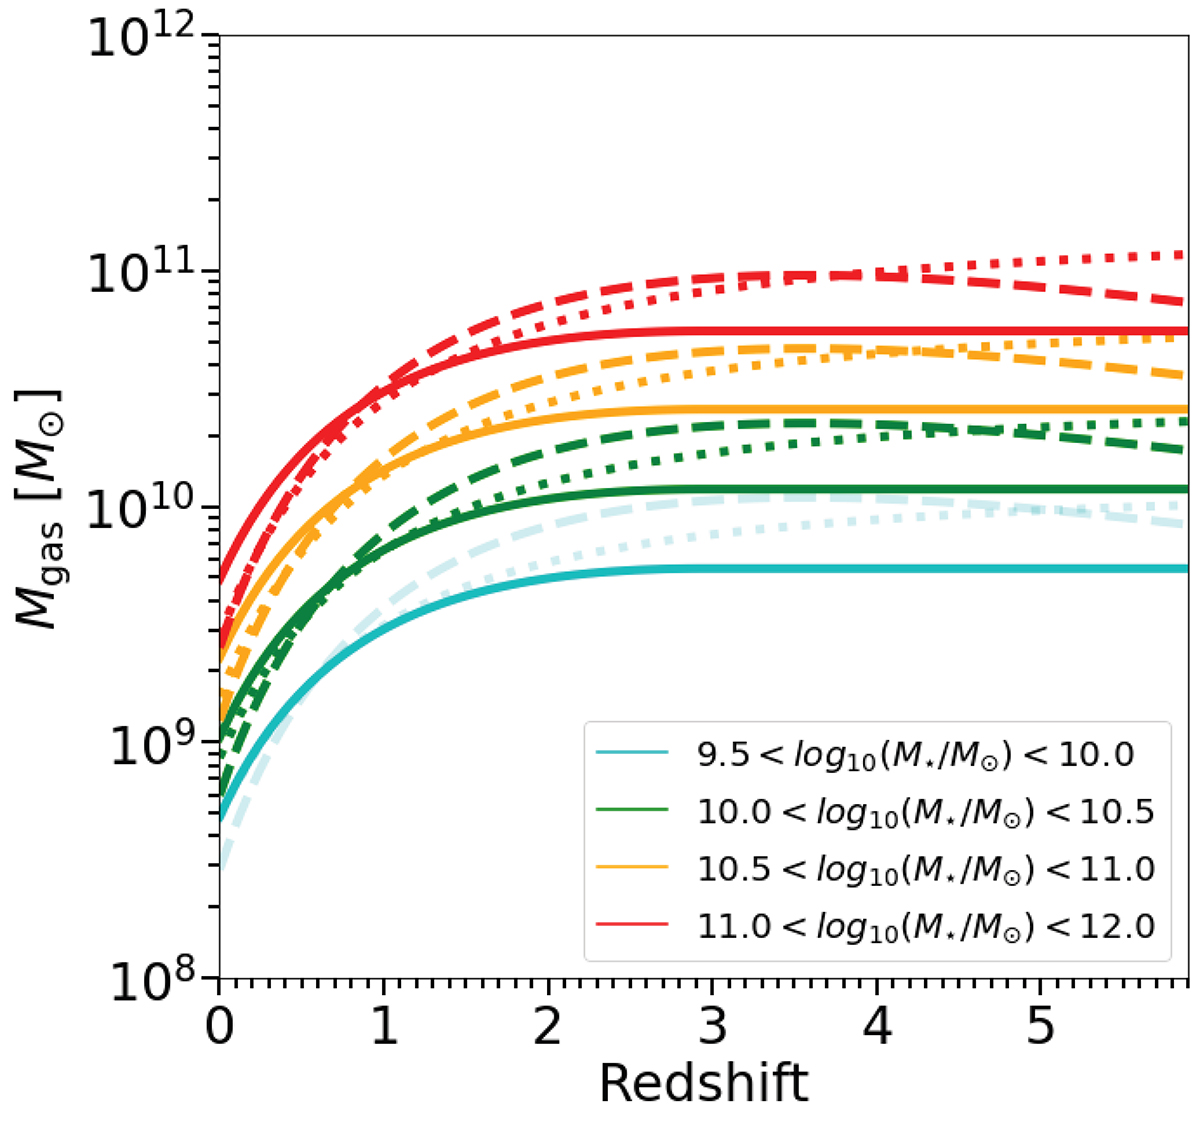
Fig. 8.
Download original image
Mgas as a function of redshift and M⋆. The solid lines represent the best-fit from this work colour-coded by M⋆ (using Eq. (21)), the dashed lines represent the trend from Tacconi et al. (2018), the dotted lines are from Wang et al. (2022). The faded lines represent an extrapolation from their respective laws.
Current usage metrics show cumulative count of Article Views (full-text article views including HTML views, PDF and ePub downloads, according to the available data) and Abstracts Views on Vision4Press platform.
Data correspond to usage on the plateform after 2015. The current usage metrics is available 48-96 hours after online publication and is updated daily on week days.
Initial download of the metrics may take a while.