Fig. 7.
Download original image
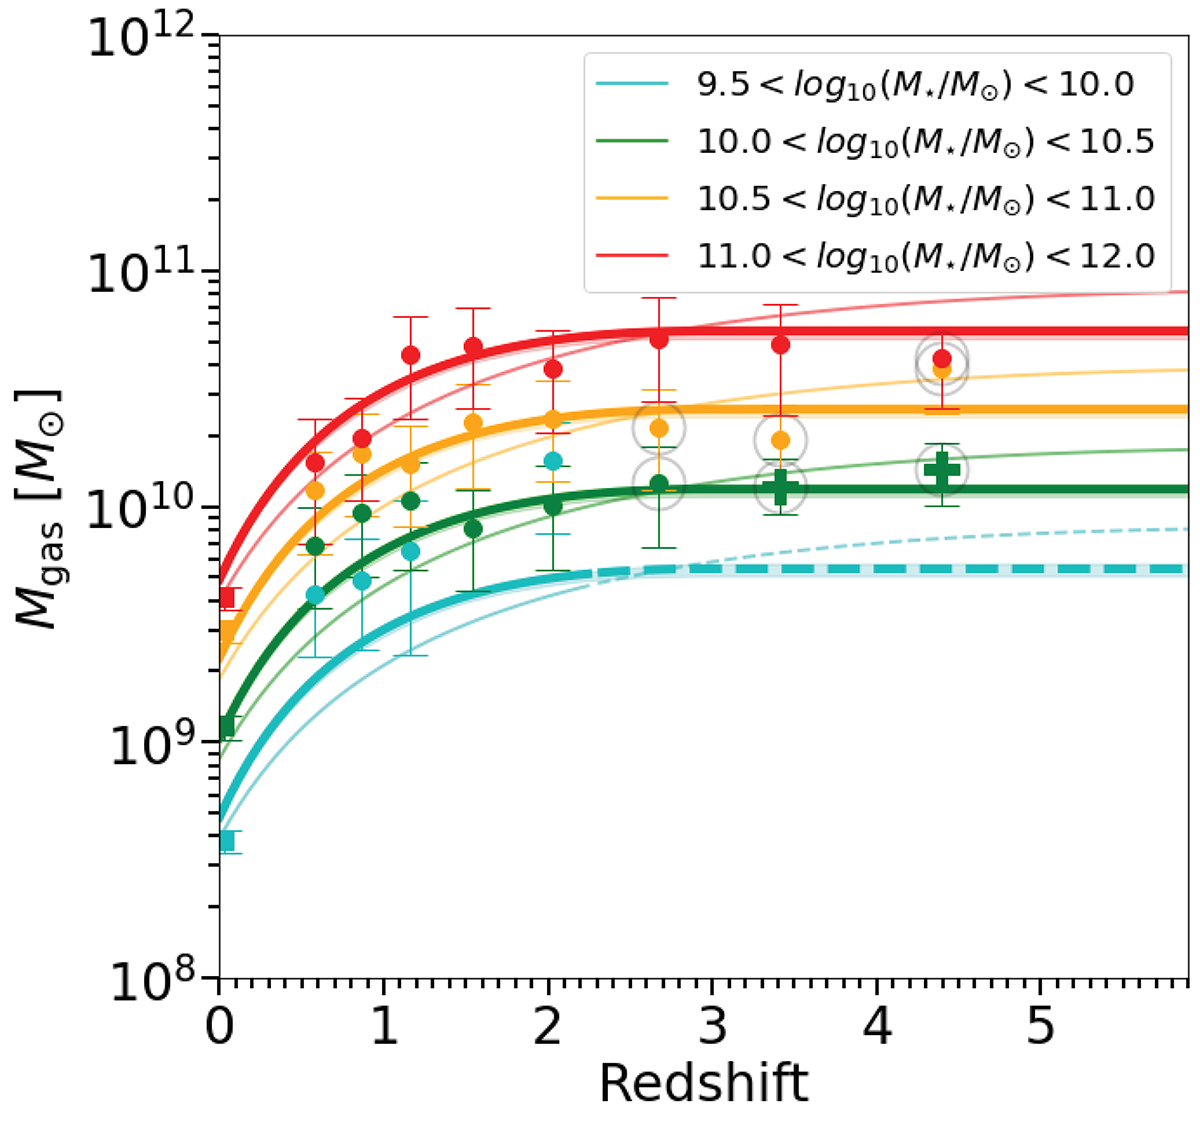
Mgas as a function of redshift for different M⋆. The dots represent Mgas estimates from this work using the ![]() method. the crosses represent Mgas estimates from this work following the method from Scoville et al. (2016). The squares are measurements from Saintonge et al. (2017). The bins that have been corrected for the H-dropout contribution are circled. The thick and thin solid colour lines represent the best-fit from this work, using Eq. (21) and Eq. (20), respectively. The dashed lines are the fits extrapolation. The shaded area the 68% uncertainty of the fit.
method. the crosses represent Mgas estimates from this work following the method from Scoville et al. (2016). The squares are measurements from Saintonge et al. (2017). The bins that have been corrected for the H-dropout contribution are circled. The thick and thin solid colour lines represent the best-fit from this work, using Eq. (21) and Eq. (20), respectively. The dashed lines are the fits extrapolation. The shaded area the 68% uncertainty of the fit.
Current usage metrics show cumulative count of Article Views (full-text article views including HTML views, PDF and ePub downloads, according to the available data) and Abstracts Views on Vision4Press platform.
Data correspond to usage on the plateform after 2015. The current usage metrics is available 48-96 hours after online publication and is updated daily on week days.
Initial download of the metrics may take a while.