Fig. 6.
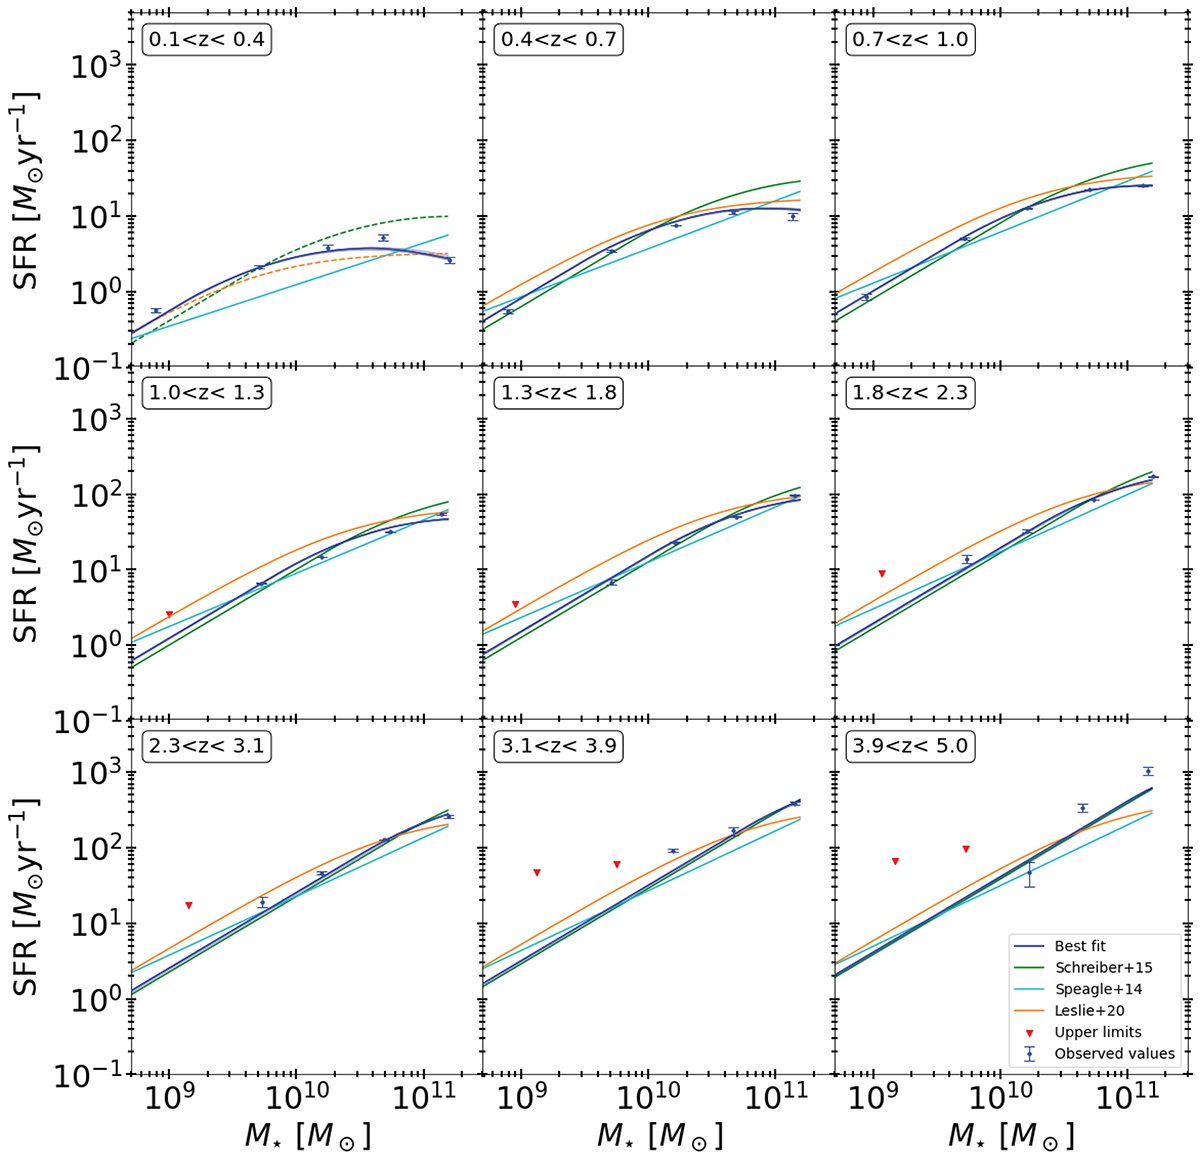
Download original image
SFRMS as a function of M⋆. The red triangles represent upper limits, the blue dots are the observed values from this work, and shaded area the 68% uncertainty of the fit. The blue lines represent the best-fit from this work. The green, cyan and orange lines represents the main sequence from S15, Speagle et al. (2014) and Leslie et al. (2020), respectively. The dashed lines represent extrapolated main sequences to redshifts that were not investigated in their respective studies.
Current usage metrics show cumulative count of Article Views (full-text article views including HTML views, PDF and ePub downloads, according to the available data) and Abstracts Views on Vision4Press platform.
Data correspond to usage on the plateform after 2015. The current usage metrics is available 48-96 hours after online publication and is updated daily on week days.
Initial download of the metrics may take a while.