Fig. 5.
Download original image
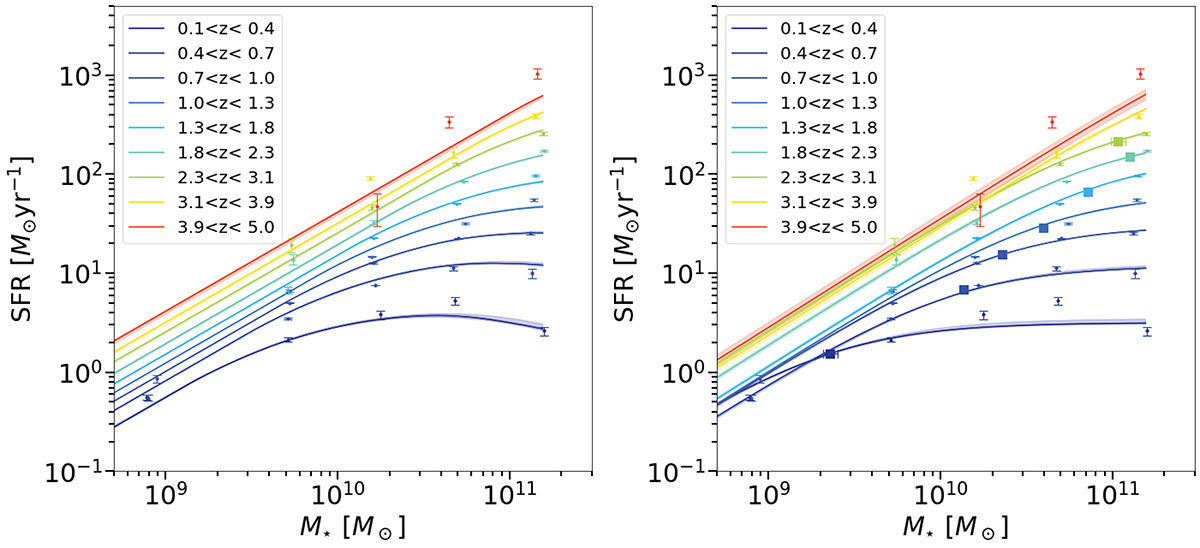
SFRMS as a function of M⋆ over different redshift bins. The dots represent data from this work. The upper limits were used to perform the fit but are not shown here to avoid overloading the figure. Left panel: fitted by the Eq. (12), the shaded area the 68% uncertainty of the fit. Right panel: fitted by the Eq. (13), the shaded area the 68% uncertainty of the fit. The squares represent the best-fit parameter M0. No bending was detected for z > 3.1 and therefore no square error bars are displayed.
Current usage metrics show cumulative count of Article Views (full-text article views including HTML views, PDF and ePub downloads, according to the available data) and Abstracts Views on Vision4Press platform.
Data correspond to usage on the plateform after 2015. The current usage metrics is available 48-96 hours after online publication and is updated daily on week days.
Initial download of the metrics may take a while.