Fig. 4.
Download original image
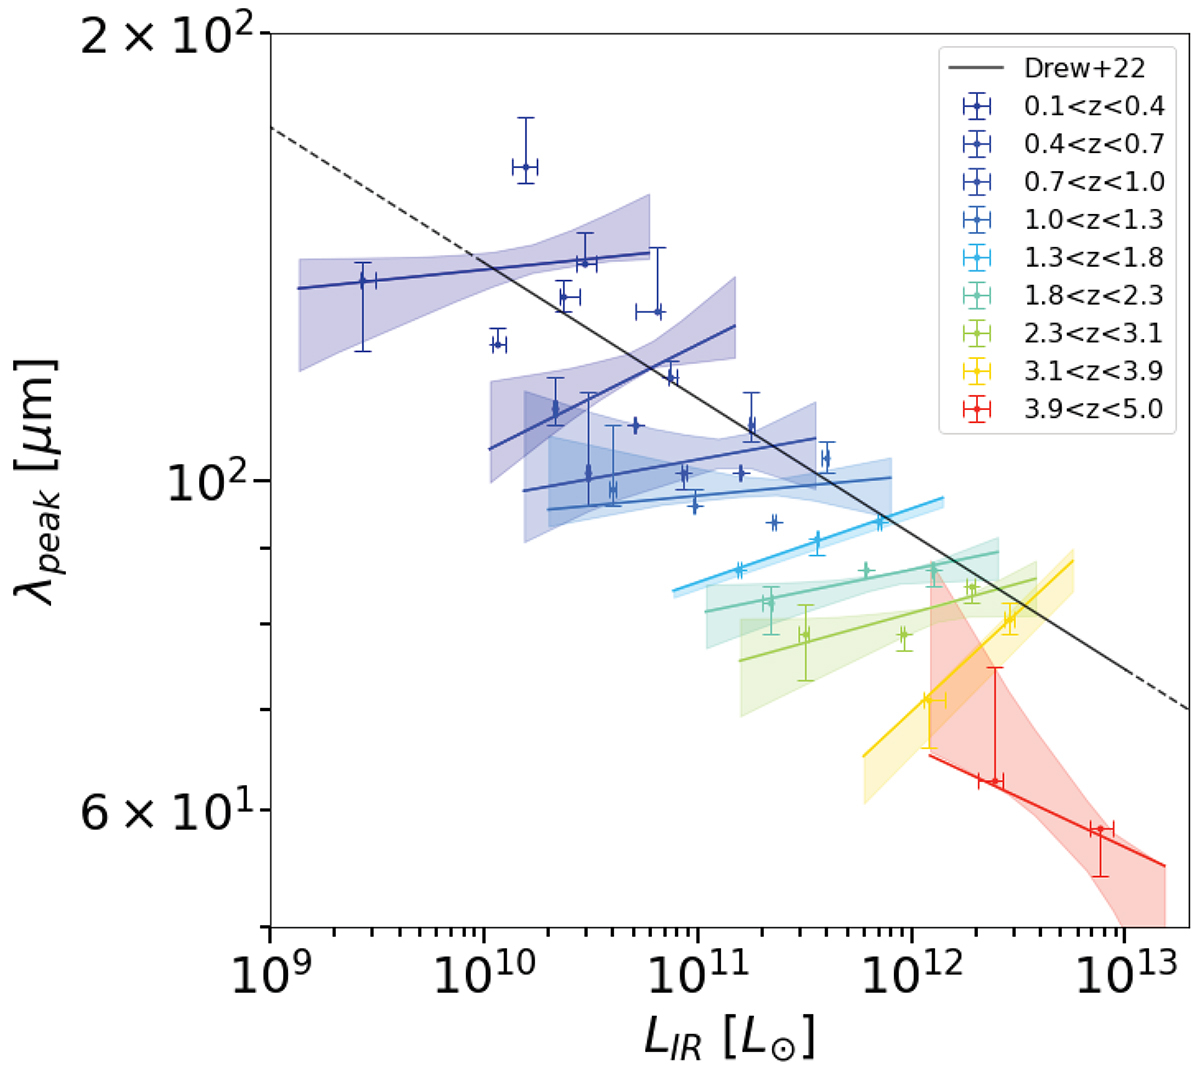
λpeak as a function of LIR. The colour-coded error bars (per redshift bins) represent the results of this work, coloured lines represent the best-fit and shaded area the 68% uncertainty of the fit. The solid black line corresponds to the trend of Drew & Casey (2022), while the dotted black line is an extrapolation of their relation.
Current usage metrics show cumulative count of Article Views (full-text article views including HTML views, PDF and ePub downloads, according to the available data) and Abstracts Views on Vision4Press platform.
Data correspond to usage on the plateform after 2015. The current usage metrics is available 48-96 hours after online publication and is updated daily on week days.
Initial download of the metrics may take a while.