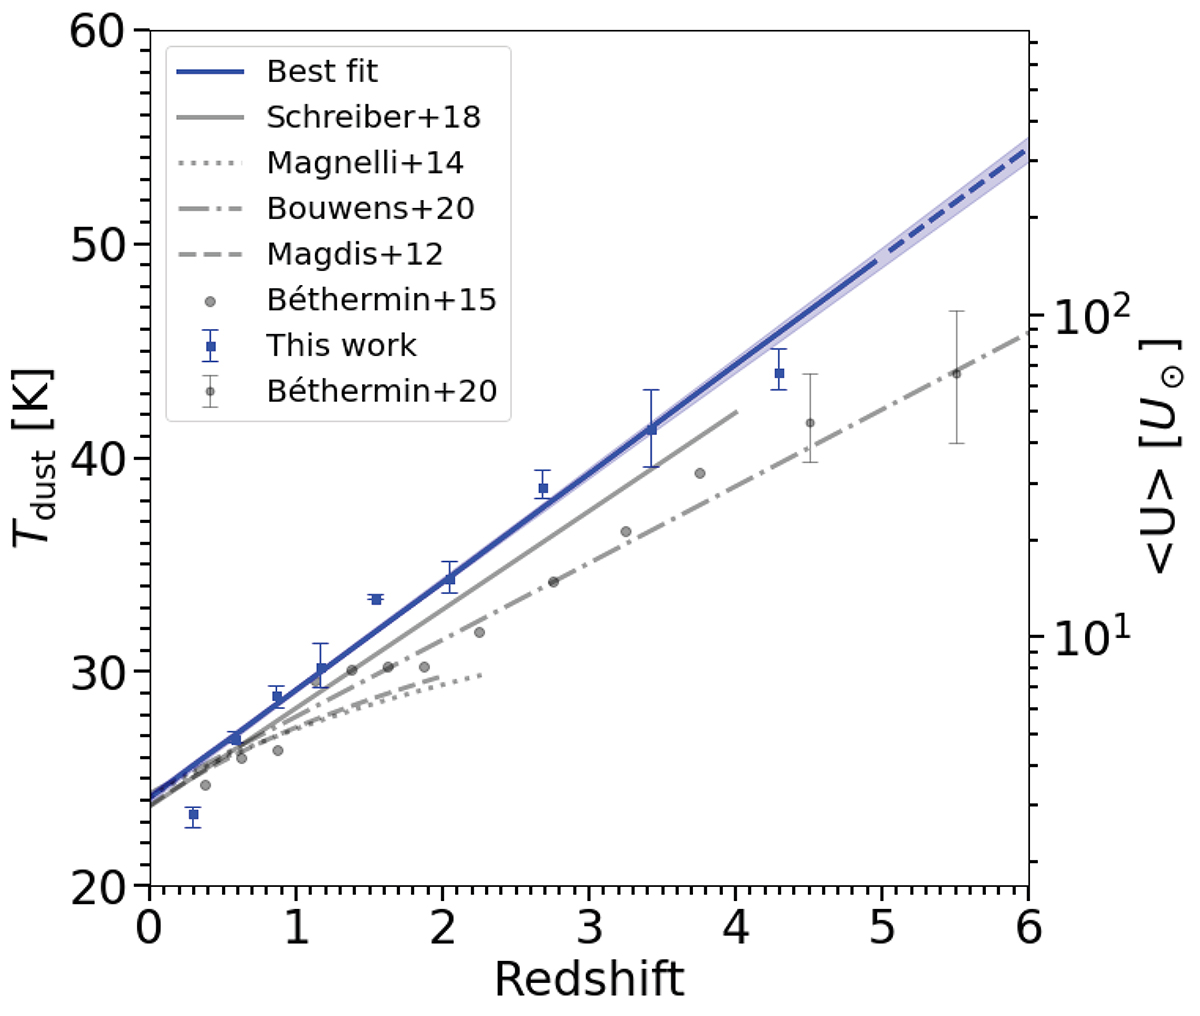
Fig. 3.
Download original image
Tdust and ⟨U⟩ as a function of redshift. The blue dots represent the Tdust of this work, the blue line is the best-fit (up to z = 5), the dashed blue line is the best-fit extrapolation (for z ≥ 5), and the blue shaded area represents the 68% uncertainty of the fit. From the literature: S18 (grey solid line), Magnelli et al. (2014) (grey dotted line) and Bouwens et al. (2020) (grey dash-dotted line) converted using Eq. (8). Magdis et al. (2012) (grey, dashed line) and Béthermin et al. (2015) (grey dots) converted using Eq. (9). We also re-fitted the two stacks from Béthermin et al. (2020) (grey dotted error bars) using template library from S18.
Current usage metrics show cumulative count of Article Views (full-text article views including HTML views, PDF and ePub downloads, according to the available data) and Abstracts Views on Vision4Press platform.
Data correspond to usage on the plateform after 2015. The current usage metrics is available 48-96 hours after online publication and is updated daily on week days.
Initial download of the metrics may take a while.