Fig. B.3.
Download original image
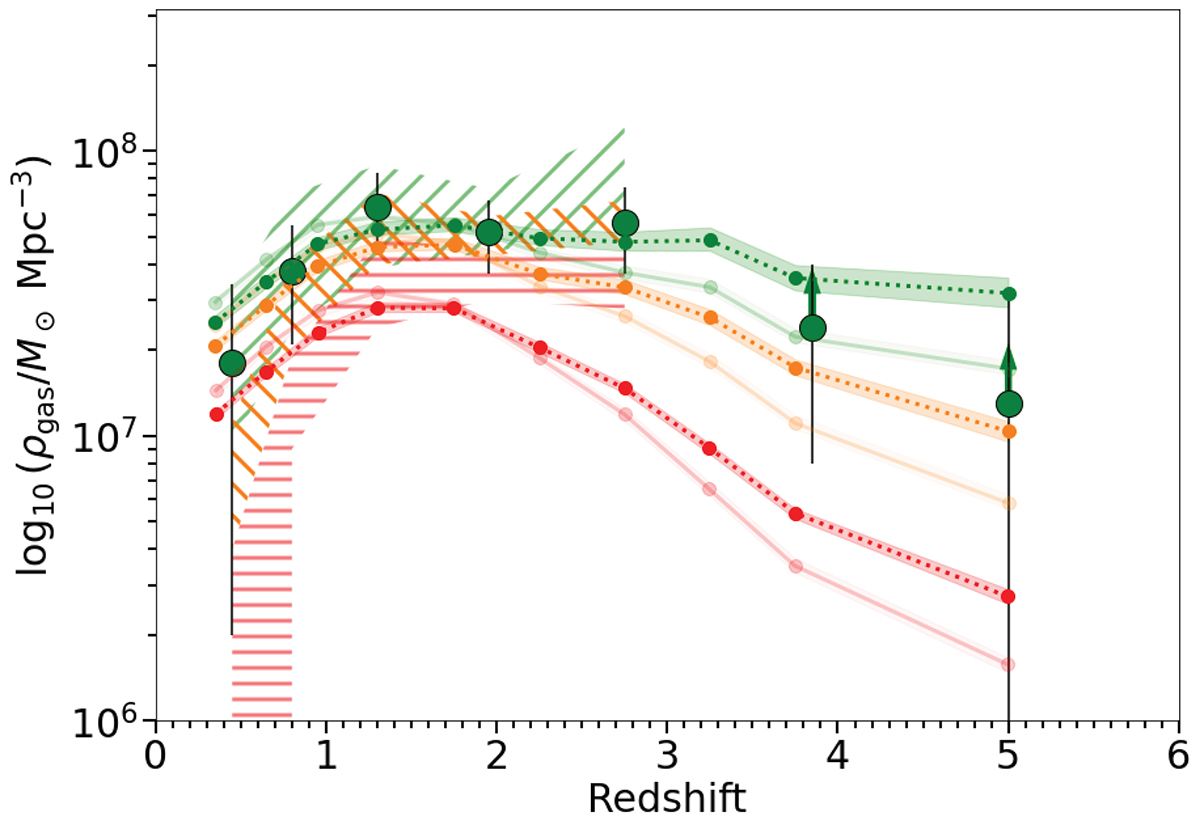
ρgas as a function of redshift. The green, orange and red dotted lines represent ρgas derived from this work with ![]() of 1.7 × 10⁸, 1.7 × 10⁹ and 1.7 × 10¹⁰ M⊙, respectively, using Mgas deduced with the Scoville et al. (2016) method only. The corresponding result deduced throughout this paper are displayed in faded solid red, orange and green coloured lines. The green, orange and red hatches represent estimates of ρgas from Magnelli et al. (2020) with
of 1.7 × 10⁸, 1.7 × 10⁹ and 1.7 × 10¹⁰ M⊙, respectively, using Mgas deduced with the Scoville et al. (2016) method only. The corresponding result deduced throughout this paper are displayed in faded solid red, orange and green coloured lines. The green, orange and red hatches represent estimates of ρgas from Magnelli et al. (2020) with ![]() of 1.7 × 10⁸, 1.7 × 10⁹ and 1.7 × 10¹⁰ M⊙, respectively. The green dots with black circles depict the estimate of ρgas from Magnelli et al. (2020) for M⋆ > Mlimit, Mlimit being the stellar mass completeness limit from Magnelli et al. (2020).
of 1.7 × 10⁸, 1.7 × 10⁹ and 1.7 × 10¹⁰ M⊙, respectively. The green dots with black circles depict the estimate of ρgas from Magnelli et al. (2020) for M⋆ > Mlimit, Mlimit being the stellar mass completeness limit from Magnelli et al. (2020).
Current usage metrics show cumulative count of Article Views (full-text article views including HTML views, PDF and ePub downloads, according to the available data) and Abstracts Views on Vision4Press platform.
Data correspond to usage on the plateform after 2015. The current usage metrics is available 48-96 hours after online publication and is updated daily on week days.
Initial download of the metrics may take a while.