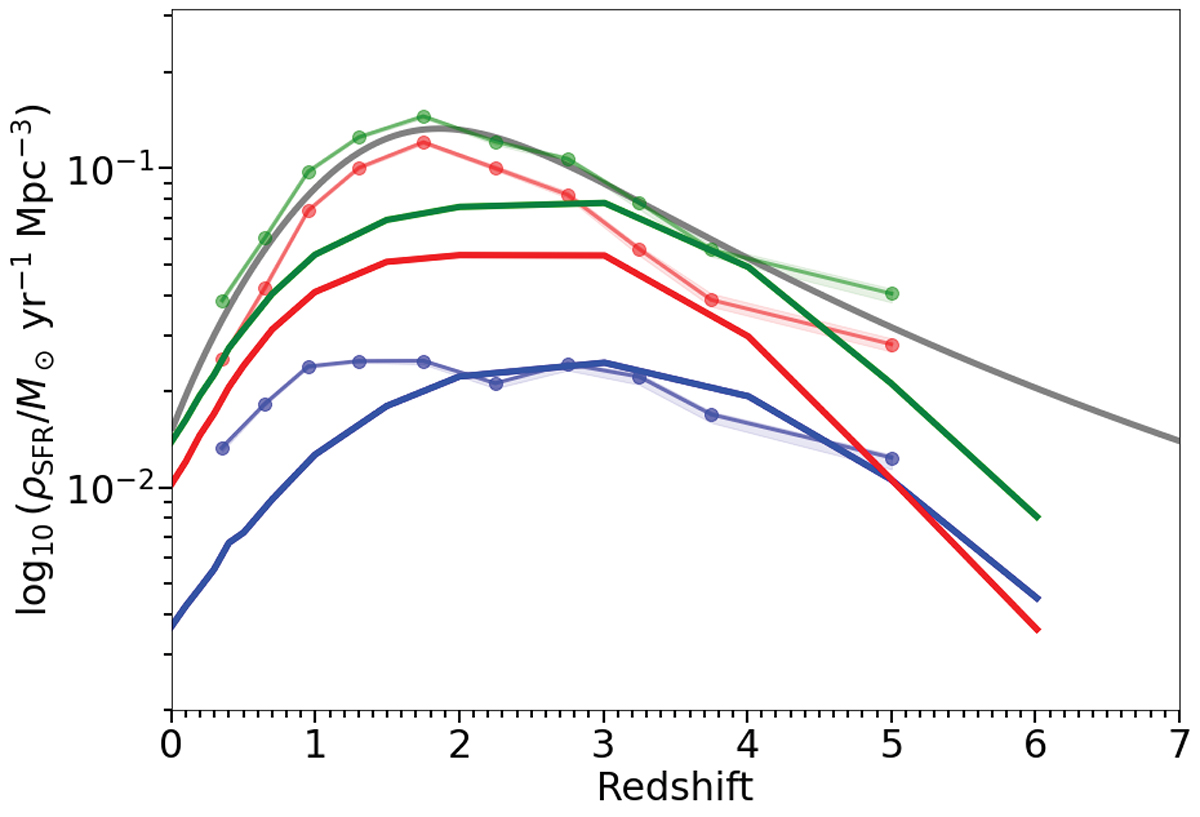
Fig. 15.
Download original image
Cosmic star formation rate density (ρSFR) as a function of redshift. The green, red and blue lines represent ρSFR deduced from the TNG100 simulation integrated from 3 × 10⁹ M⊙, including all galaxies, galaxies with log10(M⋆/M⊙)> 10, and galaxies with log10(M⋆/M⊙)< 10, respectively. The green, red and green faded dots represent the total ρSFR trend, ρSFR of galaxies with log10(M⋆/M⊙)> 10, and galaxies with log10(M⋆/M⊙)< 10, respectively (including H-dropout contribution from Wang et al. 2019), from this work. The grey line represents the trend from Madau & Dickinson (2014) for reference.
Current usage metrics show cumulative count of Article Views (full-text article views including HTML views, PDF and ePub downloads, according to the available data) and Abstracts Views on Vision4Press platform.
Data correspond to usage on the plateform after 2015. The current usage metrics is available 48-96 hours after online publication and is updated daily on week days.
Initial download of the metrics may take a while.