Fig. 13.
Download original image
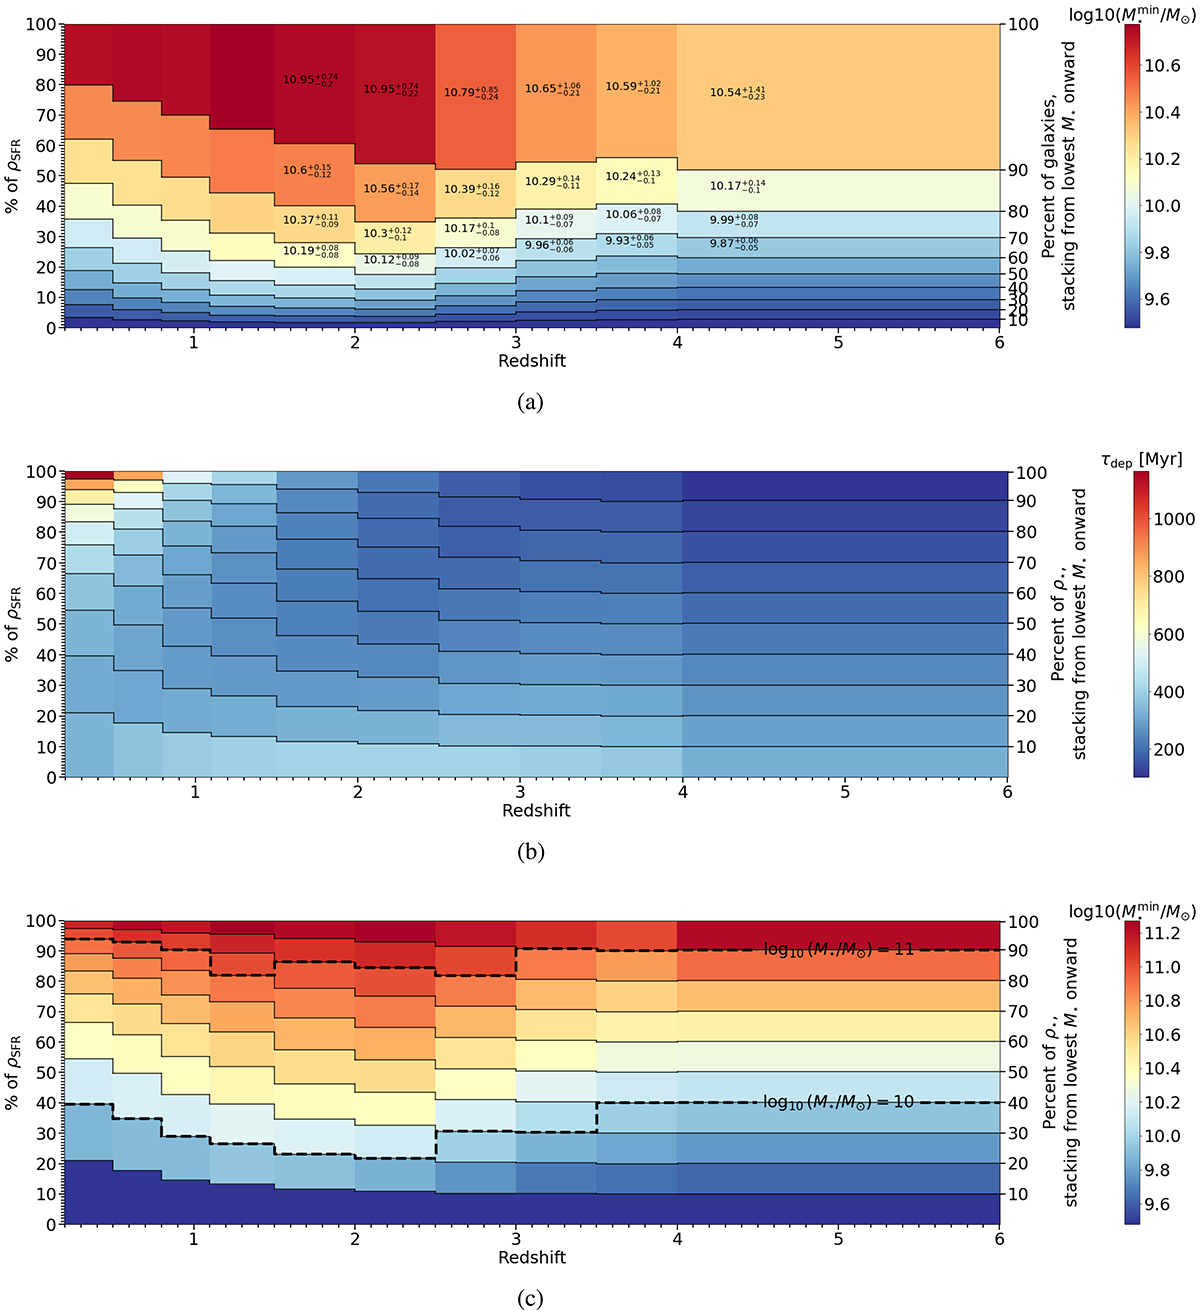
Contribution to ρSFR of SFGs as a function of redshift. Catalogues were binned through different methods and a specific property is displayed through colours: see each sub-figure for specifics. (a) Each bin includes 10% of the galaxies in number, picking from the lowest M⋆ onwards. The minimum M⋆ in the bin defines the colour. The numbers give the median M⋆ within the bin along with the lower and maximum extension of the bin. (b) Each bin includes 10% of the total M⋆ of all galaxies, picking from the lowest M⋆ onwards. The median τdep in the bin defines colour. (c) Each bin includes 10% of the total M⋆ of all galaxies, picking from the lowest M⋆ onwards. The minimum M⋆ in the bin defines the colour. Contours of log10(M⋆=M⊙) = 10 and log10(M⋆=M⊙) = 11 are added as black dashed lines.
Current usage metrics show cumulative count of Article Views (full-text article views including HTML views, PDF and ePub downloads, according to the available data) and Abstracts Views on Vision4Press platform.
Data correspond to usage on the plateform after 2015. The current usage metrics is available 48-96 hours after online publication and is updated daily on week days.
Initial download of the metrics may take a while.